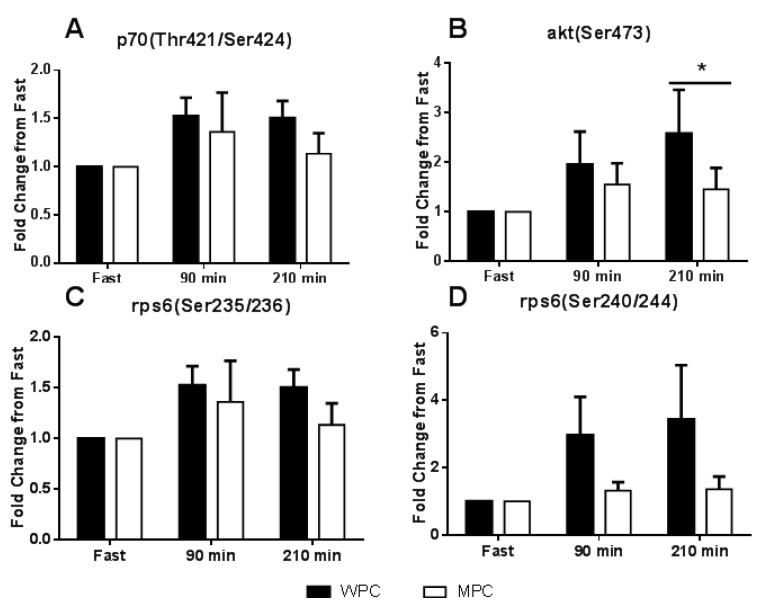
Figure 5.
Muscle anabolic signaling. (A) Change in p70S6K phosphorylation at threonine 421 and serine 424 sites from the fasted state, solid bar represent WPC ingestion and open bars represent MPC ingestion. (B) Change in Akt phosphorylation at the serine 473 site from the fasted state. (C) Change in ribosomal protein S6 (rpS6) phosphorylation at the serine 235/236 sites from the fasted state. (D) Change in ribosomal protein S6 (rpS6) phosphorylation at the serine 240/244 sites from the fasted state. The solid horizontal line represents a main effect for time. *, different from fast p ≤ 0.05. Error bars represent standard error of the mean.

