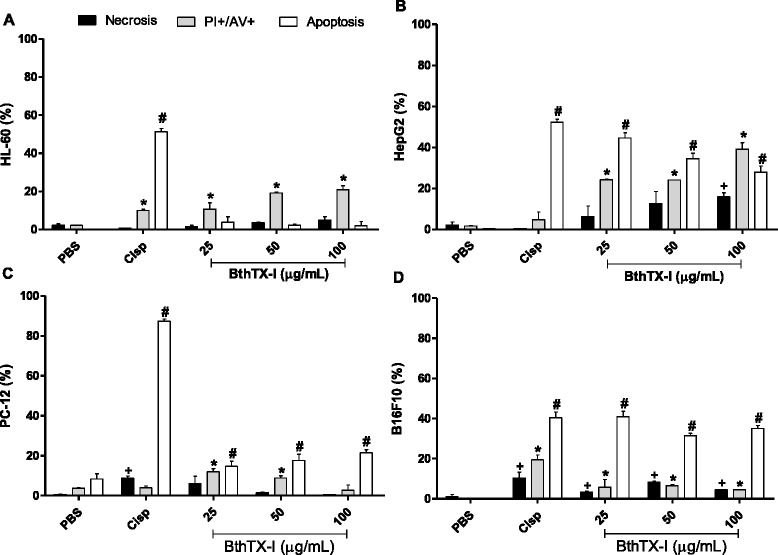
Fig. 3.

Assessment of apoptotic/necrotic effects of BthTX-I on the tumor cell lines HL-60 (a), HepG2 (b), PC-12 (c) and B16F10 (d) by flow cytometry. Tumor cells were treated with BthTX-I at different concentrations (25, 50 or 100 μg/mL). Cisplatin (Cisp, positive control) was used as a reference for the induction of apoptosis and cells treated only with PBS were used as negative control. The population of necrotic cells was labeled with propidium iodide (PI+), apoptosis was labeled with FITC-annexin V (AV+) and population of necrotic and apoptotic cells was labeled with PI+/AV+. Results expressed as mean ± SD of three independent experiments (n = 3). Statistically significant differences (p < 0.05) were labeled with * (values of PI+/AV+ compared with PBS); # (values of AV+ compared with PBS) or + (values of PI+ compared with PBS)
