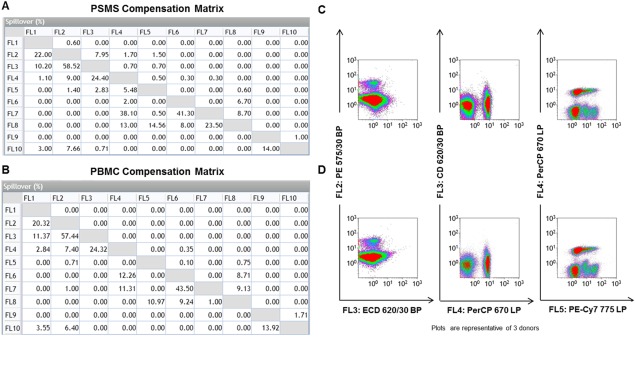
Figure 2.

PSMS vs. PBMC generate two different compensation matrices. A: The compensation matrix generated for PSMS stained with panel specific markers and (B) single‐color PBMC stained with panel specific markers is displayed. C: Compensation between FL2 vs. FL3, FL3 vs. FL4, and FL4 vs. FL5 is highlighted. C: PBMC stained with panel specific markers were given the compensation matrix generated by PSMS stained with panel specific antibodies post‐acquisition in Kaluza analysis. D: The same PBMC stained with panel specific markers were given the compensation matrix generated by the single color PBMC stained with panel specific antibodies postacquisition in Kaluza analysis (row D). Compensation between FL2 vs. FL3, FL3 vs. FL4, and FL4 vs. FL5 is highlighted. All plots are gated on PBMC based on light scatter. [Color figure can be viewed in the online issue, which is available at wileyonlinelibrary.com.]
