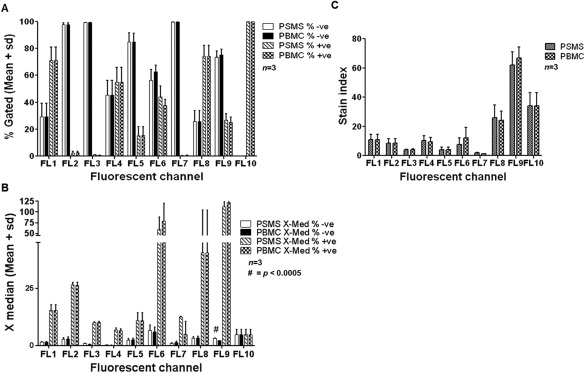
Figure 4.

Analysis of three donors indicate that data obtained from PSMS vs. PBMC generated compensation matrices are similar. A: Mean and standard deviation of negative and positive populations for each T cell panel marker using compensation matrices generated from PSMS and PBMC. B: X‐Median (Median fluorescence intensity) of three donors PBMC stained with panel specific markers given the compensation matrix generated by PSMS and PBMC. C: SI of PBMC from three donors using PSMS and PBMC matrices.
