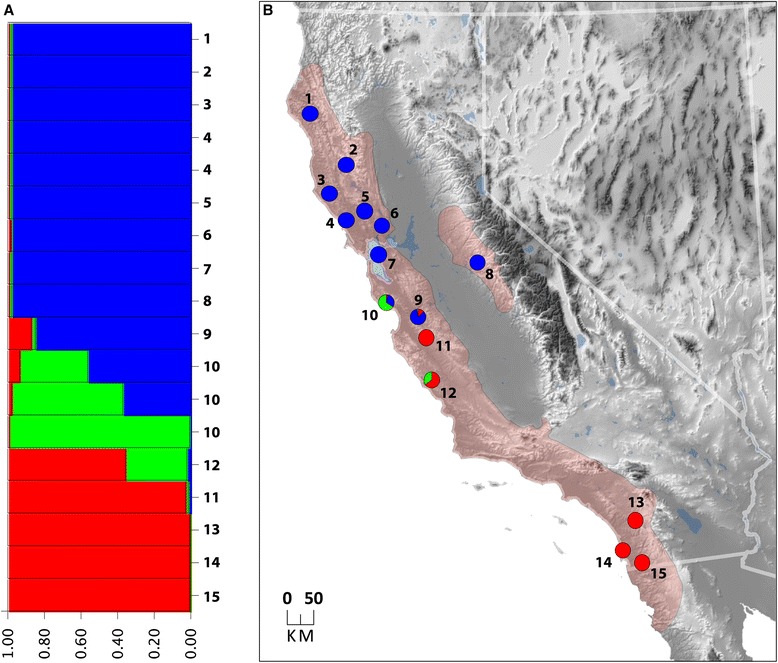
Fig. 5.

a Population structure of Aneides lugubris is depicted in the bar plot where each horizontal bar represents one individual, and the proportion of each color corresponds to the probabilities that the individual is assigned to one of three genetic clusters. b The spatial arrangement of these three gene pools where the number of each locality corresponds to the bar plot numbers, and the beige shaded area is the estimated range of A. lugubris
