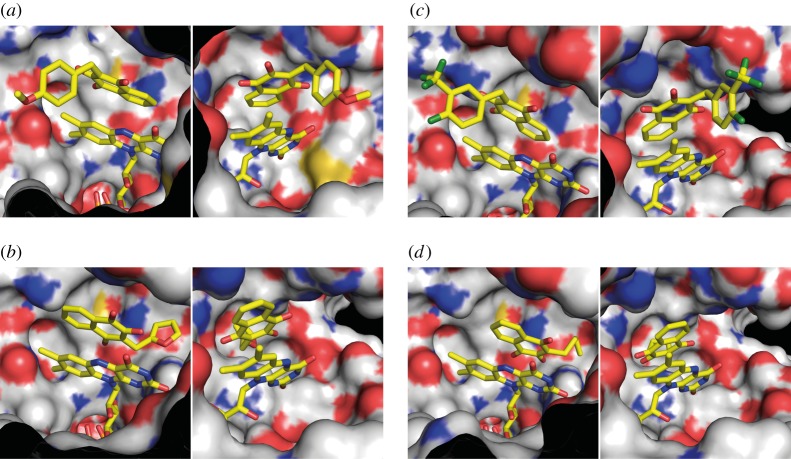
Figure 5.
Three-dimensional modelling of HpThyX–inhibitor complexes using Autodock Vina. FAD and HpThyX inhibitor are depicted in stick representations with carbon, oxygen, nitrogen and fluorine atoms coloured in yellow, red, blue and green, respectively. The HpThyX surface is shown with carbon, oxygen, nitrogen and sulfur atoms coloured grey, red, blue and yellow, respectively. Some amino acids were removed for clarity. Two orientations, separated by a 90° rotation along the y-axis, are shown. (a) 007-A (C8-C1). (b) 010-C. (c) 010-E. (d) 010-I.

