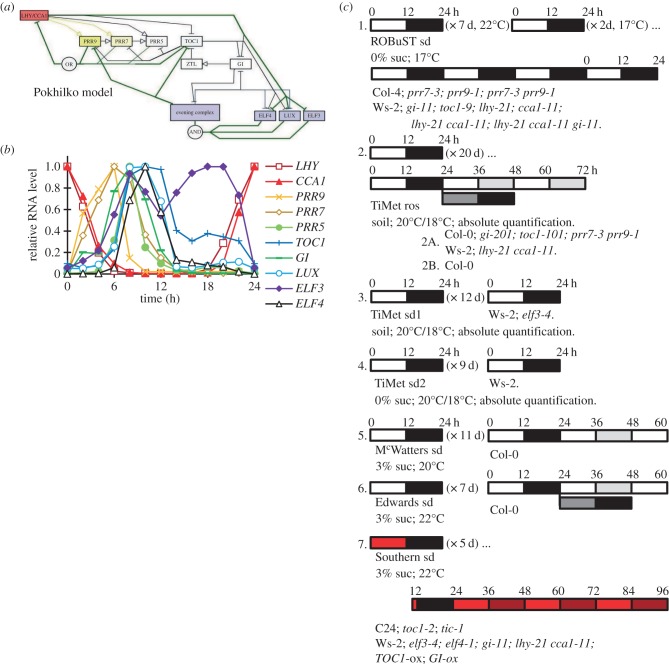
Figure 1.
The clock gene network and experimental protocols. (a) The clock gene network summarized in the activity-flow language of SBGN v. 1.0 [8], with the principal connections in the P2012 model [9]. The repressilator is denoted by green lines; morning loop components are filled yellow; LHY/CCA1, red; evening loop components, blue. Light inputs are shown in electronic supplementary material, figure S1 and all modelled connections of P2011 [10] in electronic supplementary material, figure S2. (b) Peak-normalized RNA profiles of genes depicted in (a), in plants of the Col-0 accession under a 12 h light : 12 h dark cycle (LD 12 : 12; experiment 2b of panel (c)). (c) Graphical representation of the growth conditions. Experiments 1, 4, 5, 6 and 7 used seedlings grown in LD 12 : 12 for the number of days indicated; experiments 2 and 3 used plants grown on soil in LD 12 : 12 for the number of days indicated. Sucrose concentrations, growth temperatures and genotypes tested are shown for each experiment. Open box, light interval; black box, dark interval; light grey box, predicted darkness in constant light; dark grey box, predicted light in constant darkness; red box, red light. Sampling time in ZT (h), relative to lights-on of the first day of sampling or the last dawn before experimental treatment (ZT0). Ros, rosette; sd, seedling.

