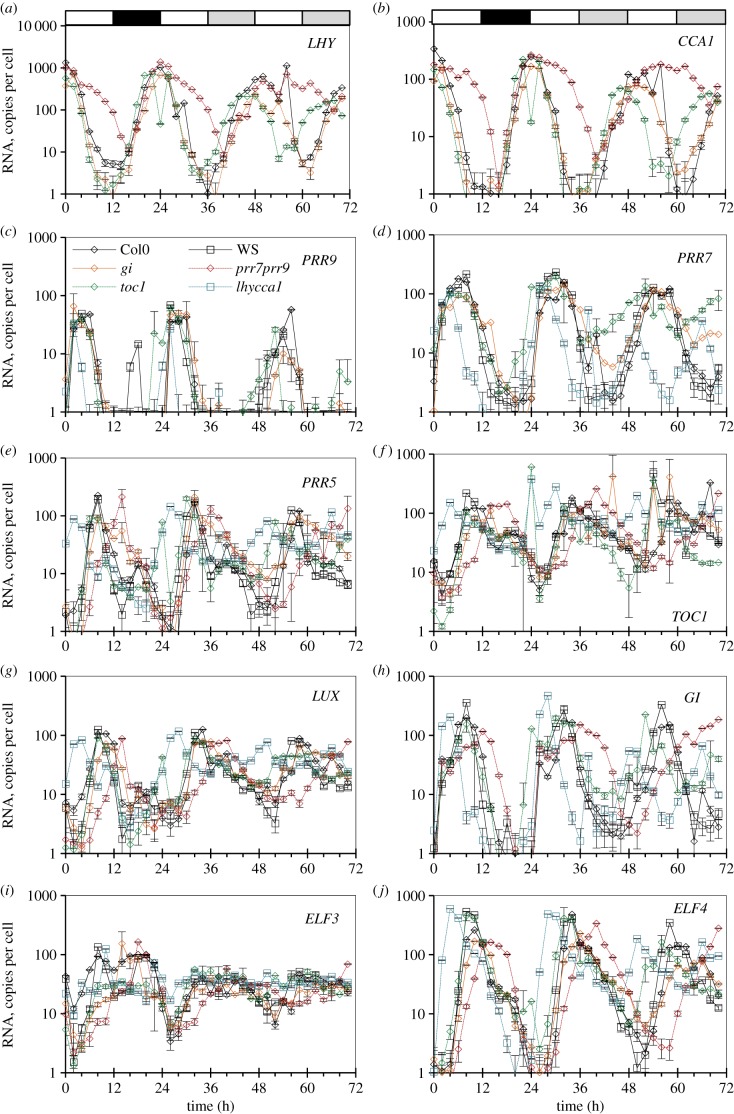
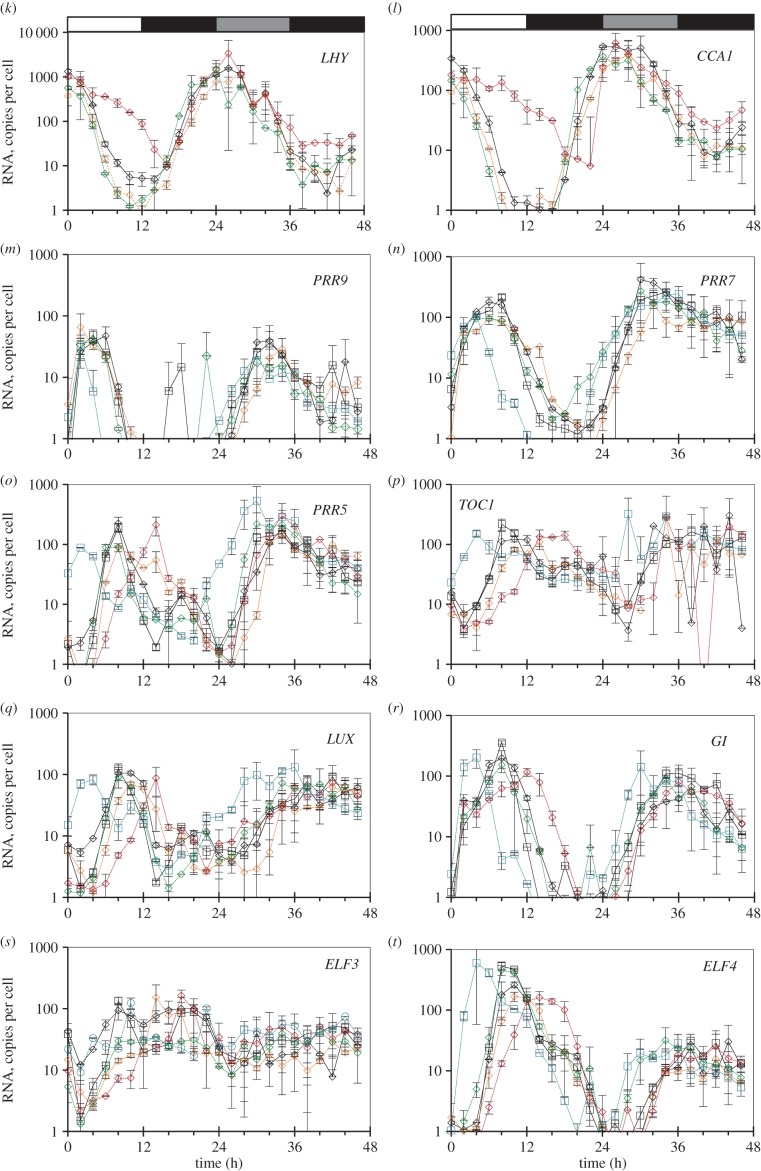
Figure 5.
Clock gene expression in wild-type plants and clock mutants in LD, and after transition to constant light (LL) or darkness (DD). Col-0 and Ws-2 WT, the lhy-21 cca1-11 and prr7-3 prr9-1 double mutants, and the toc1-101 and gi-201 single mutants were grown in a 12 h photoperiod for 20 days, harvested through a LD cycle and then transferred to LL (a–j) or DD (k–t; TiMet ros, dataset 2 of figure 1c). Transcript levels for clock genes were measured by qRT-PCR, including eight external RNA standards to allow absolute quantification. (a,k) LHY, (b,l) CCA1, (c,m) PRR9, (d,n) PRR7, (e,o), PRR5, (f,p), TOC1, (g,q) LUX, (h,r) GI, (i,s) ELF3, (j,t) ELF4. The results are the mean of duplicate samples, error bars show SD. Open box, light interval; black box, dark interval; light grey box, predicted darkness in LL; dark grey box, predicted light in DD.


