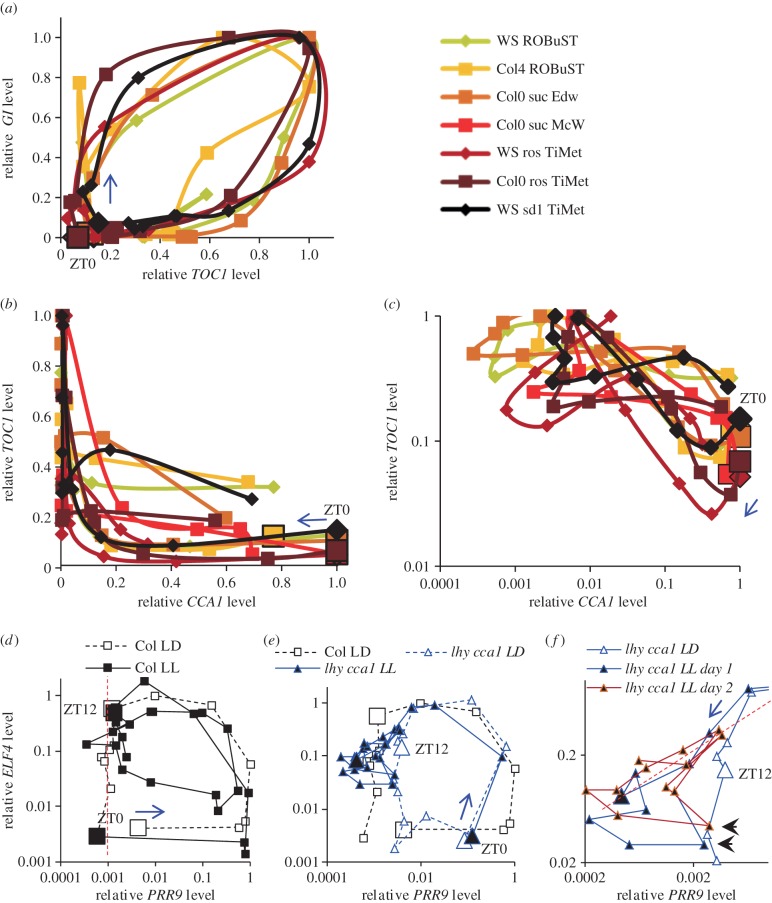
Figure 7.
Phase plane diagrams reveal pairwise gene interactions. (a–c) Normalized RNA profiles of figure 3 are represented as phase plane diagrams, plotting (a) GI and TOC1, and TOC1 and CCA1 on (b) linear and (c) logarithmic scales. Larger markers indicate ZT0 datapoint, arrows indicate the direction of time. (d–f) RNA profiles of figure 5 are represented as phase plane diagrams on logarithmic scales, plotting data for ELF4 and PRR9 (d) in wild-type Col plants under LD and LL (0–22 h in figure 5, dashed line; 24–70 h, solid line), and (e) in Col plants under LD and lhy cca1 double mutants under LD and LL (solid blue line), with (f) a rescaled view of a subset of the data from the lhy cca1 double mutants. Larger markers indicate 0 (ZT0) and 12 h (ZT12) datapoints in the cycle labelled LD. These timepoints are equivalent to 24 (ZT0) and 36 h (ZT12) in the cycle labelled LL. Arrows indicate the direction of time. (d) Red dashed line marks falling ELF4 levels during the night-time trough of PRR9 in LD. (f) Red dashed line marks correlated PRR9 and ELF4 levels; arrowheads mark an earlier peak on each cycle in PRR9. Timepoints 48 (ZT24) to 70 h (ZT46) under LL are plotted in brown to emphasize the similar profiles on successive days.

