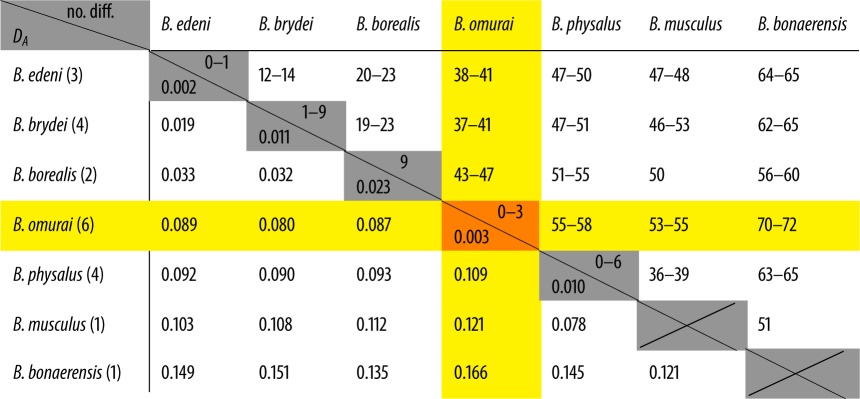
Table 1.
Pairwise sequence differences between and within species. (Between species number of sequence differences and net nucleotide substitutions per site (DA) are shown above and below the diagonal, respectively. Number of samples of each species shown in the left column.)
 |
