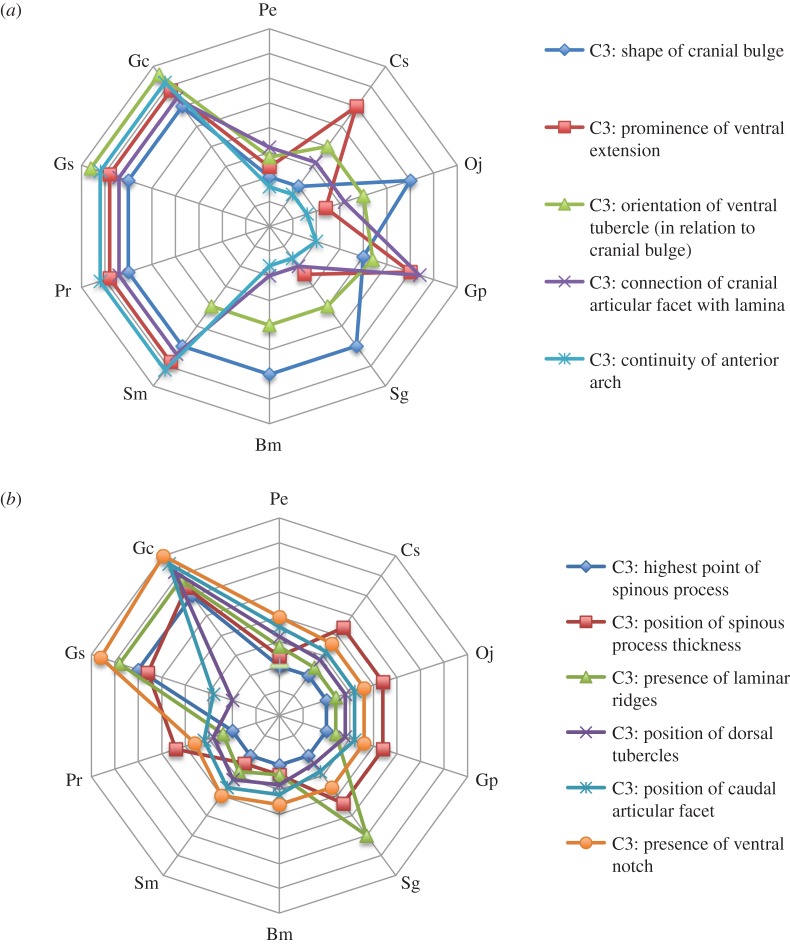
Figure 6.
Radar plot shows cranial and caudal elongation of giraffid C3 vertebrae. Pe, Prodremotherium elongatum; Cs, Canthumeryx sirtensis; Oj, Okapia johnstoni; Gp, Giraffokeryx punjabiensis; Sg, Sivatherium giganteum; Bm, Bramatherium megacephalum; Sm, Samotherium major; Pr, Palaeotragus rouenii; Ba, Bohlinia attica; Gs, Giraffa sivalensis; Gc, Giraffa camelopardalis. Y-axes represent giraffid species. X-axes demonstrate the degree of elongation of a given character; the centre of the plot represents the shortened state while the lateral portion of the plot represents the elongation state. Each star plot represents a specific vertebral characteristic. (a) Radar plot depicting the cranial elongation characters. S. major, P. rouenii, G. sivalensis and G. camelopardalis exhibit the greatest degree of cranial elongation. (b) Radar plot depicting the caudal elongation characters. A caudal pull on C3 can be seen in G. sivalensis, and is most pronounced in G. camelopardalis.

