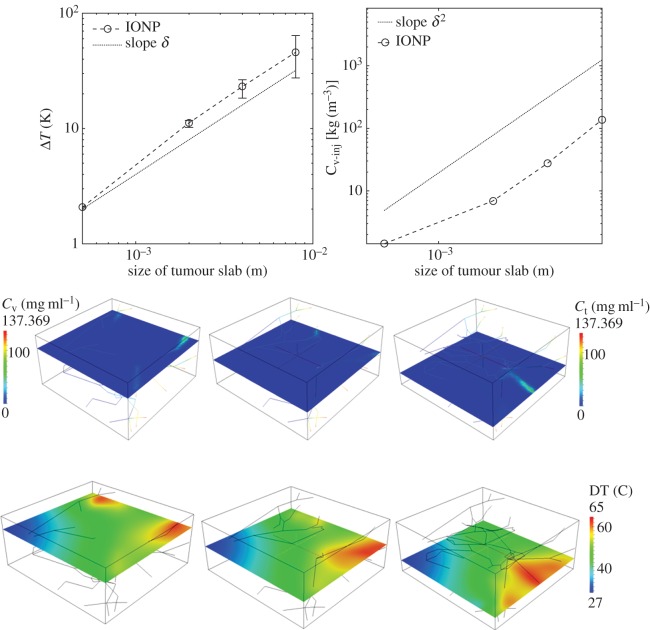
Figure 5.
(Top panels) Hyperthermia predictions for variable tumour size (open circle, marker) when cref is fixed to 1 mg ml−1. The trend of the injected concentration of particles required to maintain cref constant is shown on the right. Error bars visualize the temperature heterogeneity, namely the difference , when the tumour size increases. (Bottom panels) Calculated IONP concentration and temperature maps at time 40 min for tumour size of 8 mm (δ=16).

