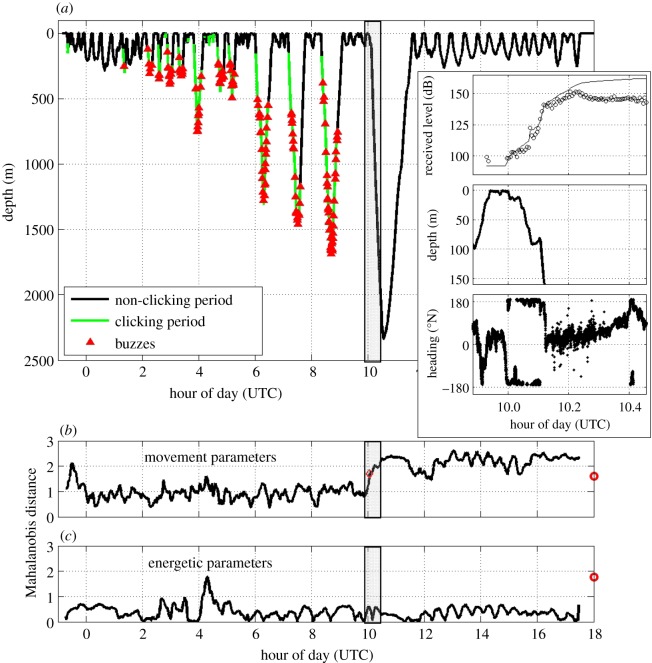
Figure 1.
(a) Time-depth record of tagged whale ha13_176a with the timing of the sonar exposure period lightly shaded between vertical lines. Sounds are marked by colour: black indicates periods when no foraging sounds were produced by the tagged whale, green shows periods when the tagged whale was producing foraging echolocation clicks and red triangles indicate buzzes (i.e. likely foraging attempts). The inset box highlights data during the sonar exposure period and shows received levels of the sonar with ping by ping SPL (in dB re 1 μPa) shown as ‘open circles’ and cumulative sound exposure level (in dB re 1 μPa2 s) as a solid line (top), zoomed whale depth truncated at 150 m to show detail at the start of the dive (middle) and whale heading (bottom). (b) Mahalanobis distance values for movement parameters. Red circle on the right indicates the response threshold and red diamond in the graph indicates when the response threshold was exceeded. (c) Mahalanobis distance values for energetic parameters. Red circle on the right indicates the response threshold.

