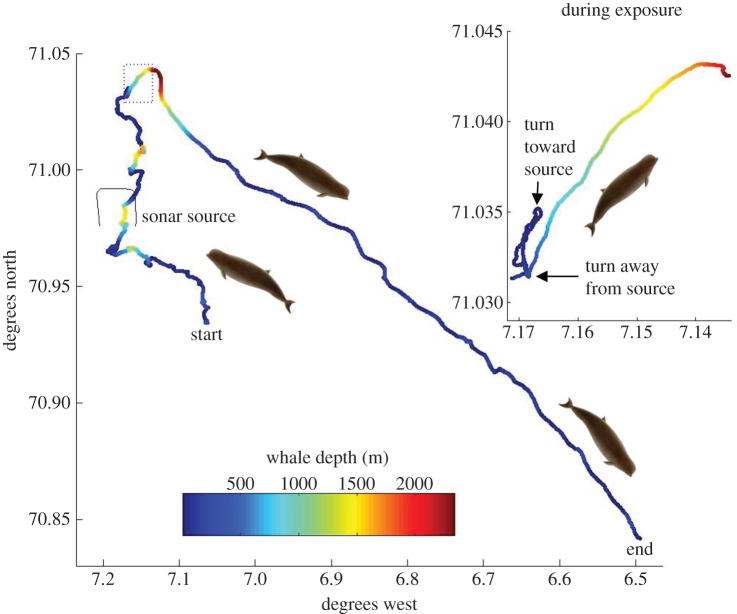
Figure 2.
Geometry of the controlled exposure experiment and movement of the tagged whale before, during and after the sonar exposure. Colour of the track indicates whale depth (m). The track of the sonar source during the exposure is plotted as a thin black line. The source moved counterclockwise during the exposure. Inset box shows detail of whale movement during the 35 min exposure period, indicated by a dashed box on the overall track.

