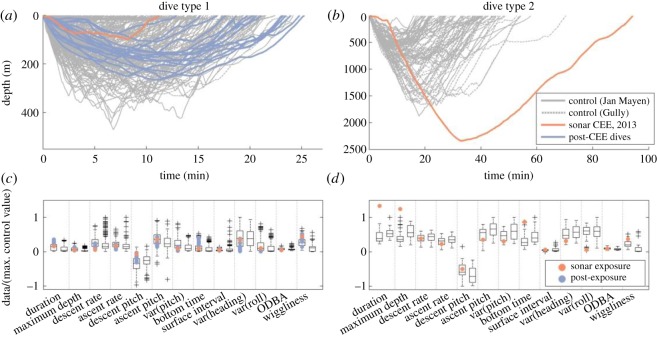
Figure 3.
Dive profiles and dive parameters by dive type. The figure includes all 477 shallow-short dives (a,c) and 79 long-deep dives (b,d) recorded from 14 tag records of northern bottlenose whales (eight records from the Gully, six from Jan Mayen). Note unequal x- and y-axis scales (a,b). Dives without sound exposure are plotted in grey; dives overlapping controlled exposures to 1–2 kHz sonar in orange; and post-exposure dives by the exposed whale in blue. Paired box-plots are shown for each dive parameter of each dive type (c,d), with data from Jan Mayen (including the exposure whale) to the left and data from Gully to the right for each parameter. For the box-plots, to facilitate showing many variables on a single plot, all values were scaled before plotting by dividing by the maximum of the absolute value of all control observations. Here, ‘control’ observations include dives by unexposed animals, as well as pre-exposure dives by the exposed whale in Jan Mayen. Black boxes span 25–75th percentiles, black horizontal lines mark medians, error bars span 1.5 interquartile ranges and+symbols indicate more extreme values. Dive parameters from exposure and post-exposure dives are plotted individually. Symbol and colour-coding match (a,b).

