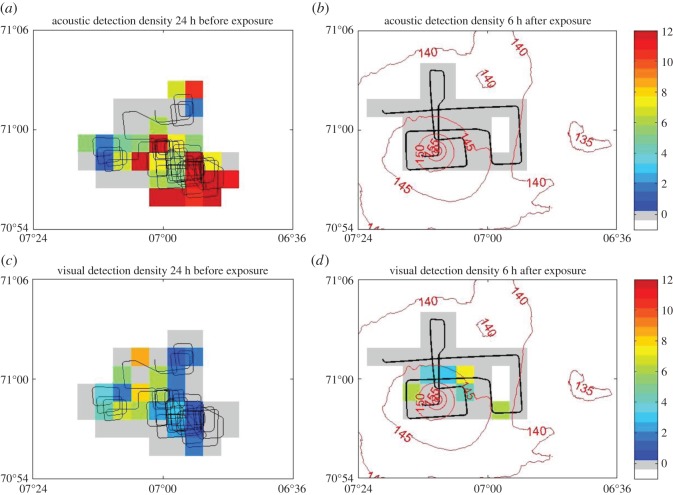
Figure 5.
Both acoustic (a,b) and visual (c,d) detections of northern bottlenose whales decreased in density comparing rate of detection during 24 h prior to sonar exposure (a,c) and 6 h after sonar exposure (b,d). The track of the research vessel is shown (black line) together with coloured density of detections for each 2×2 km cell surveyed. Acoustic detections were quantified as number of 5 min intervals in which clicks were detected per hour. Visual detections consisted only of new groups identified and were quantified as average sightings per hour. Contour lines (b,d) indicate the SPLs (in dB re 1 μPa), averaged over 0–500 m, representative of shallow dives.

