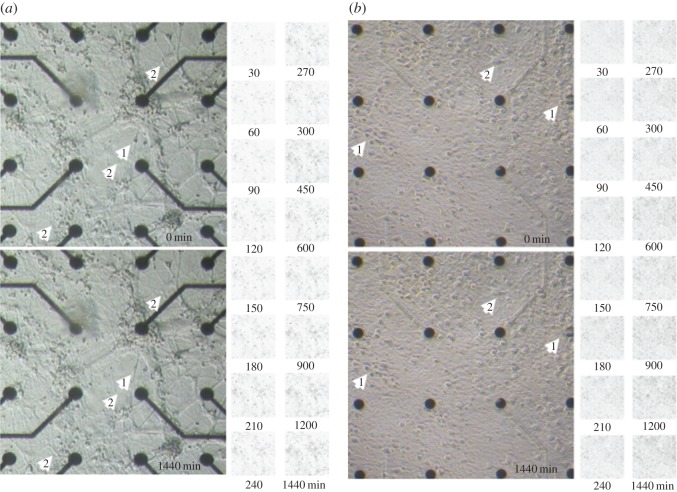
Figure 7.
Comparative image collage of local morphological fluctuations over 24 h for the two hippocampal cultures. (a) Centre of the first hippocampal culture at 18 DIPS (25 DIV). (b) Centre of second hippocampal culture at 56 DIPS (56 DIV). The lower pictures were taken 24 h after the upper pictures at the specified DIPS. White arrowheads highlight changes visible to the naked eye. Apart from the obvious relocation of small circular-shaped motile cells (not indicated), the cells either changed their relative position (1) or the shape of their soma (2). Changes occurred locally and fluctuated around individual ‘centres of gravity’. The matrices to the right depict the differences (in black) between the first image and those taken at the indicated times in minutes. The small motile cells that travel along neural processes can be observed as slightly larger black spots in the difference maps. Over a 24 h period, increasingly darkening areas indicate overall structural changes in the network architecture. These changes are clearly visible in the electronic supplementary material, Movies M2 and M4. Electrode diameters: 30 μm; electrode spacing: 200 μm.

