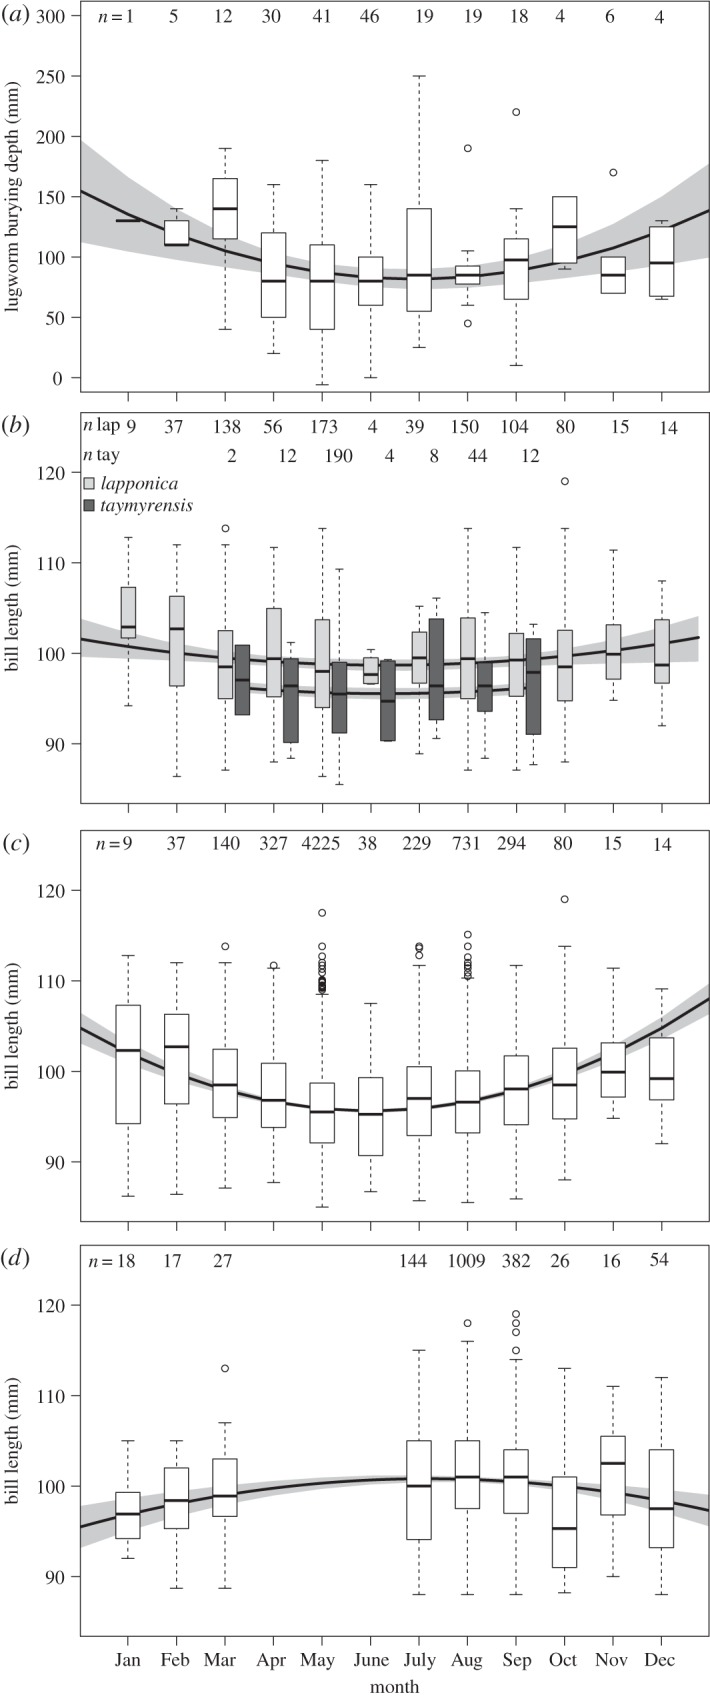
Figure 2.

By month, (a) lugworm burying depth in the Dutch Wadden Sea, (b) bill length distributions of female bar-tailed godwits in the Dutch Wadden Sea, separated for both subspecies, (c) as (b) but now subspecies pooled and (d) bill length distributions for female bar-tailed godwits in the Wash, subspecies pooled. Curved lines represent model outputs and grey areas represent 95% confidence intervals (CIs). Box plots show median (line in box), interquartile range (box), 10th and 90th percentiles (bars) and outliers (dots). Sample sizes are shown in all plots.
