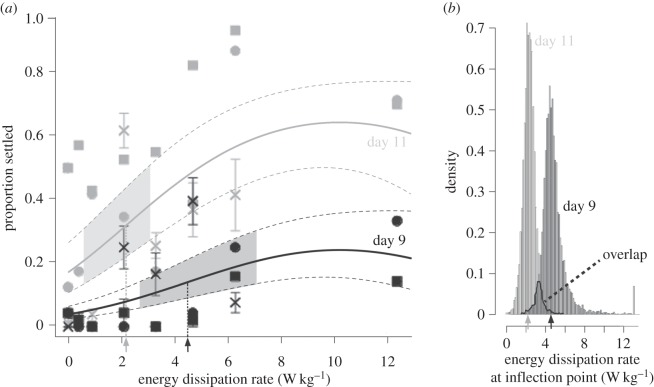
Figure 6.
Precompetent sand dollar larvae show evidence of increasing sensitivity to turbulence as ontogeny proceeds. (a) Shown are the best-fit curves (solid curves) ±95% CIs (dashed curves) generated by our best-supported general mixed linear model (see Material and methods for details and comparisons with other models). The lines and symbols (batch A, squares; batch B, circles; batch C, crosses) show the data from day 9 (black) and day 11 (grey). Error bars are s.e.m (note that the data from batch A day 11 and batch B days 9 and 11 were unreplicated, thus show no error bars). The inflection points of the best-fit curves for day 9 (black arrow) and day 11 (grey arrow) are shown along the x-axis and indicated by the black and grey vertical dotted lines, respectively. The shaded areas within the day 9 and day 11 CI curves indicate the range of 95% CIs in our respective inflection point estimates based upon 10 000 non-parametric bootstrap samples. (b) The range of inflection point estimates (and 8.5% overlap) from these bootstrap samples on days 9 and 11. Arrows as in (a). Note that the y-axis units of density are linearly related to the proportion of bootstrap samples showing a given range of inflection point estimates.

