
Figure 1.
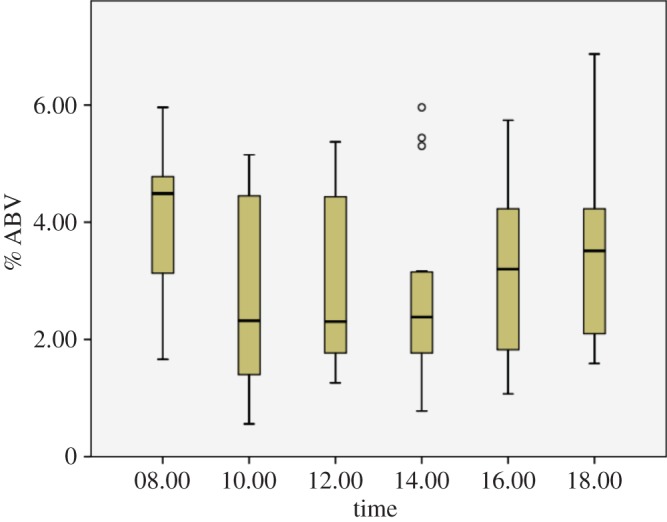
Box plot (showing maximum and minimum values as whiskers above and below the central rectangle which spans the first quartile to the third quartile; the segment inside the rectangle shows the median, and outliers are open circles) for % alcohol by volume (ABV) of palm sap from 16 raffia palms, collected at 2 h intervals (i.e. 08.00–18.00 h) throughout the day. Data presented in figure 1 come from 88 samples (maximum of six samples collected daily per raffia palm; data were unavailable for only eight of 96 samples that could have been collected, see electronic supplementary material, table S1). Sap sampled at 08.00 h had accumulated overnight, about 14 h after the previous batch of fermented sap was harvested. Following the morning harvest, fresh sap accumulated in the container until the evening harvest.