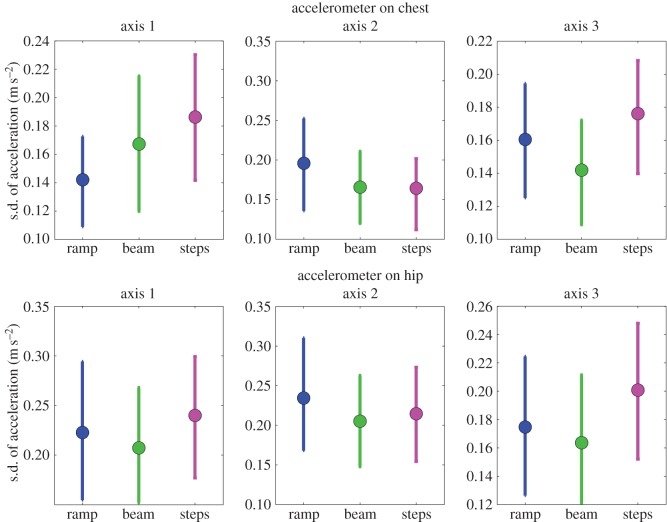
Figure 12.
Mean s.d. of acceleration recorded during the different tasks. For each participant, we used the times recorded by the floor pressure sensors to extract the accelerometry data recorded while they were performing each phase of the balance task. Because each participant was wearing two triaxial accelerometers, this produced six sets of data, shown in the six panels of the figure. We filtered the accelerations with a 40 Hz cut-off, and then calculated the s.d. of each set of filtered accelerations. We did this for each participant, both before and after they watched TV. We then averaged in order to obtain the mean s.d. values shown in the figure. For this figure and the one-way ANOVA reported in the text, we pooled across TV-groups and across before versus after viewing. This means that each data point in the figure is the mean of around 800 separate s.d. values.

