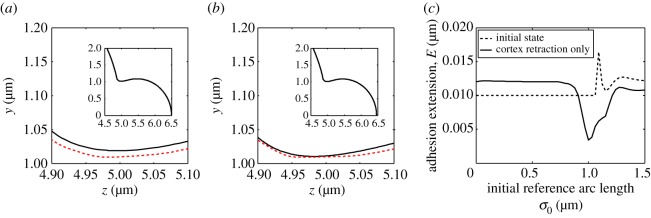
Figure 4.

Result of retracting the cortex only. In (a,b) and all following cell profile images, the plotting scheme remains the same. The solid (black) line represents the membrane, while the dashed (red) line represents the cortex. (a) The initial state of the bleb with regenerated cortex, before it begins to retract. (b) Membrane and cortex profiles during cortex retraction. Note that as the simulation progresses the membrane begins to squeeze the cortex neck. The insets in (a,b) show the full cell profile and illustrate that the bleb hardly retracts before problems arise in the neck. (c) Extension of the adhesions for the profiles illustrated in images (a,b). The dashed lines illustrate that, as intended, the cortex in the blebbed region in (a) is initialized beneath the membrane such that the new adhesions in the bleb are at their natural resting length. The solid line shows that the adhesions in (b) are compressed in the neck region, whereas they are being stretched at the front of the membrane. In addition to the parameters fixed in the text, the timescale of membrane shrinking is η2=0 s−1, while η1>0 s−1 and, thus, .
