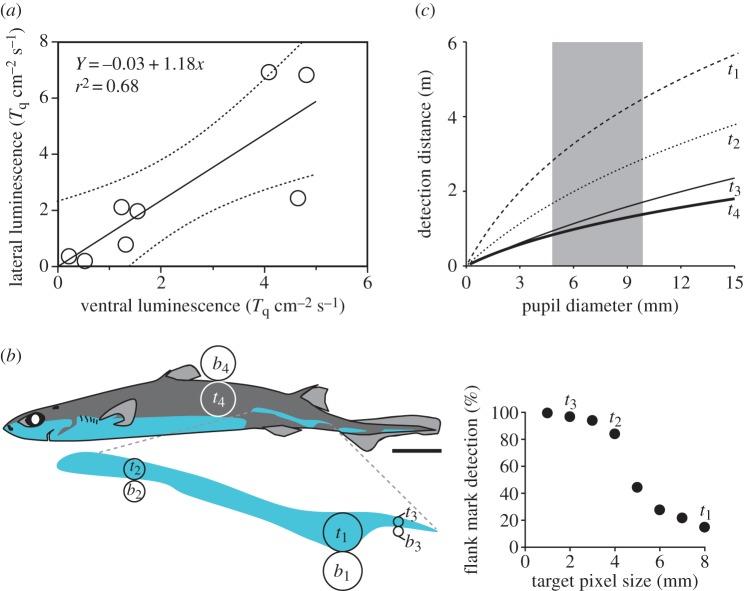
Figure 1.
In vivo recordings and visual modelling of Etmopterus spinax luminescence. (a) Correlation between lateral and ventral (counterilluminating) photophore luminescence intensity. (b) Target (t) and background (b) pixels used in the theoretical visual modelling: t1=bioluminescent detection pixel, t2=gross discrimination pixel (allowing more than 50% of the lateral pattern to be seen), t3=fine discrimination pixel (allowing more than 95% of the lateral pattern to be seen), t4=non-bioluminescent (black) detection pixel. Scale bar, 5 cm. (c) Detection distance of target pixels at counterillumination depth according to the observer's pupil diameter. The shaded area represents the pupil diameter range observed from a complete E. spinax ontogenetic series.

