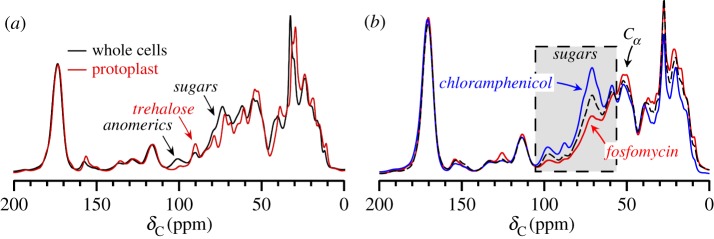
Figure 3.

Spectral comparisons of S. aureus whole cells, protoplasts, and antibiotic-treated cells. (a) Protoplast spectra exhibit a reduced polysaccharide region owing to cell-wall removal. (b) Antibiotic-treatment with fosfomycin (a cell wall inhibitor) and chloramphenicol (a protein synthesis inhibitor) results in significantly altered carbon composition in whole cells. From Nygaard et al. [53] with permission from Elsevier. (Online version in colour.)
