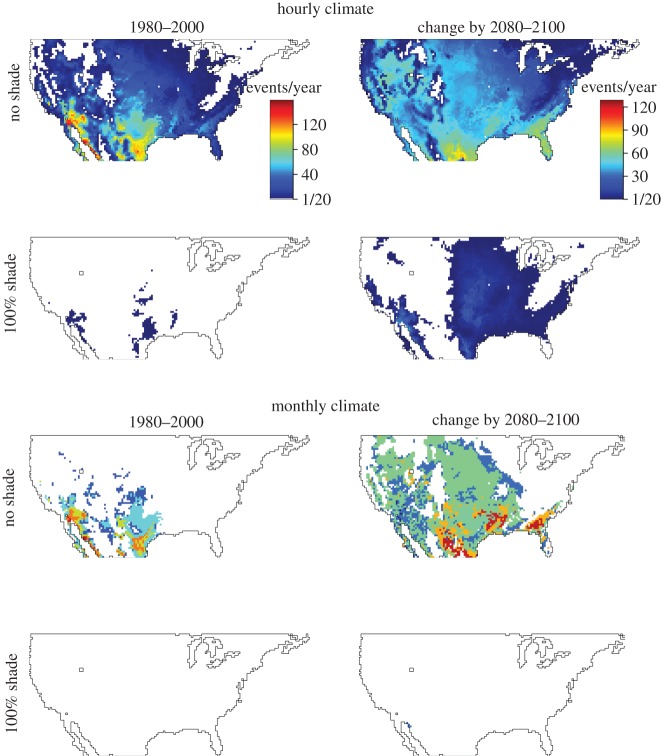
Figure 2.
Frequencies of lethal events under monthly and hourly data during past (1980–2000) climate and the predicted change in the future (2080–2100). Data are presented for nests at a depth of 6 cm under either 0 or 100% shade. White areas represent locations for which no heat events were predicted. For frequencies at other depths, see the electronic supplementary material, figures S1–S4. (Online version in colour.)

