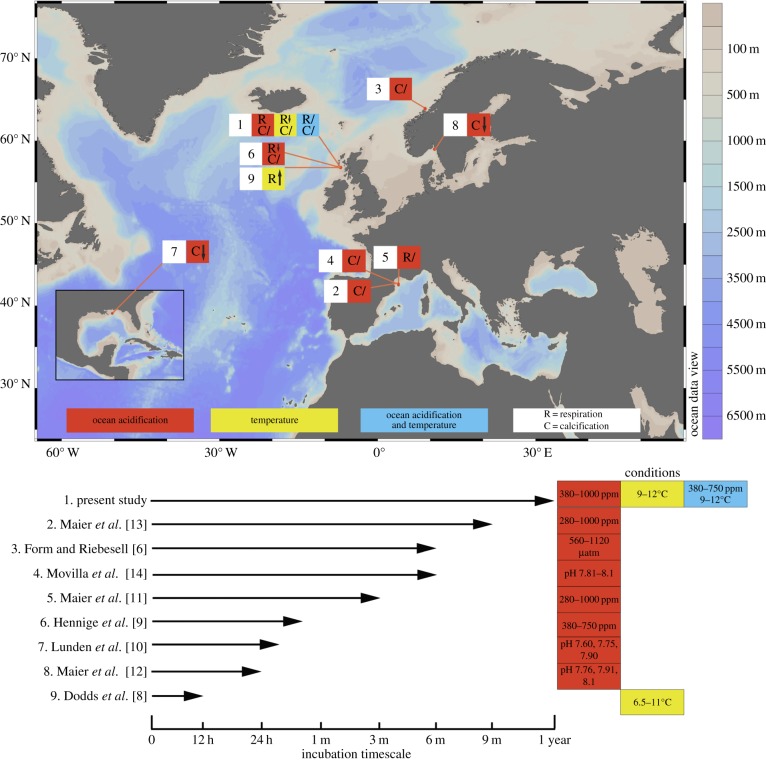
Figure 1.
Chart showing locations and summarizing physiological results from research on projected future impacts of temperature and ocean acidification on Lophelia pertusa. ‘R’, Respiration; ‘C’, calcification; ‘↑’, an increase; ‘↓’, a decrease; ‘/’, no statistically significant change. Symbols represent experiment endpoint results, pH is recorded in the total scale.

