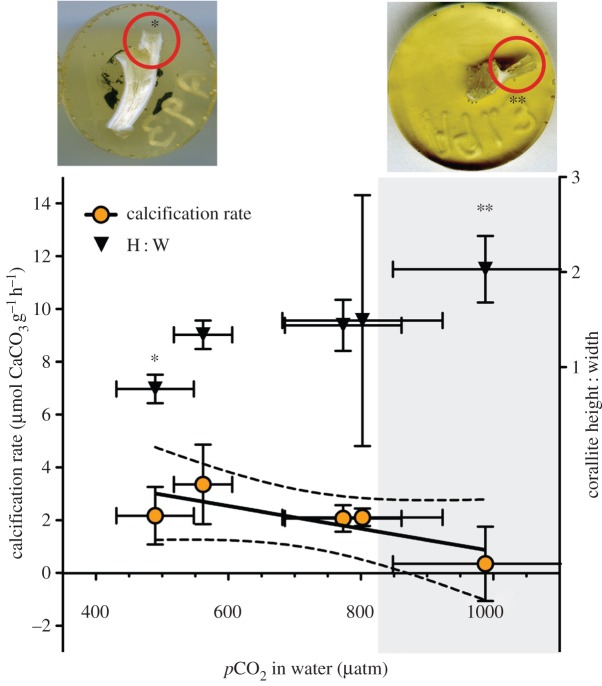
Figure 3.
Calcification rates ±s.e. of Lophelia pertusa expressed as µmol CaCO3 g−1 dry tissue h−1 versus adjusted pCO2 with linear trend ± 95% CIs at T + 12 months. Black triangles represent aspect ratio ±s.e., of newly formed corallites, with two example images of control and high CO2 treatments that significantly differed. The shaded area represents water conditions ΩAragonite < 1. Asterisks (* and **) denote example corallites represented by the data.

