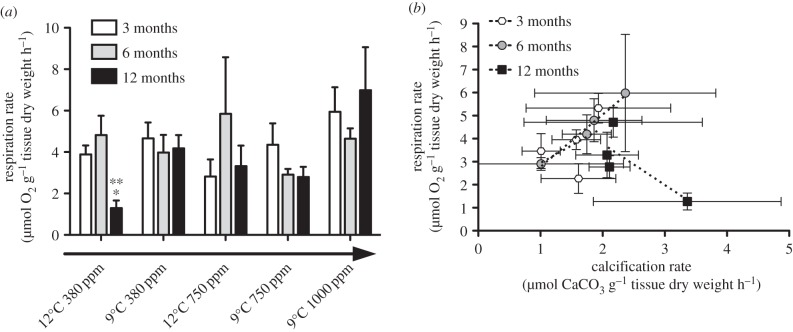
Figure 4.
(a) Respiration rates ±s.e. of Lophelia pertusa expressed as µmol O2 g−1 AFDM h−1 for each treatment at three, six and 12 month time points. Asterisks (* and **) denote significant differences at that time point between and within treatments, respectively. The arrow indicates a decrease in pH across treatments. (b) Respiration and calcification rates ±s.e. for all treatments at three, six and 12-month time points. Linear regression lines are fitted for each time point between treatments. Nine degrees Celsius 1000 ppm treatment results are excluded due to dissolution of exposed aragonite.

