
Figure 7.
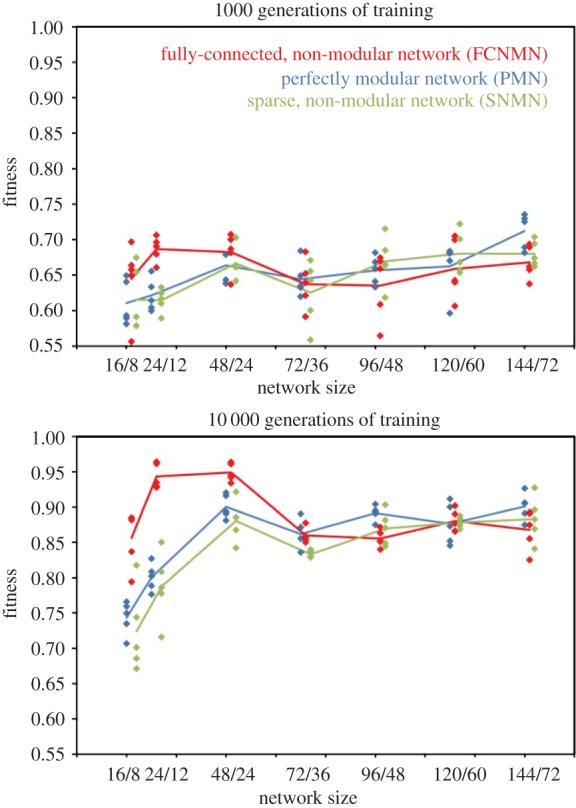
Networks conformed as networks in state 1 (figure 6) with simulations run on networks of different size with a smaller number of replicates at each size. Diamonds are raw fitness values for each simulation run and lines join means of these points. The ratios on the horizontal axis refer to the number of nodes in the input and hidden layers, respectively. All networks had a single output node. Networks of each type (red, blue and green) are offset on the horizontal axis by 0.2 to allow visualization of points. (Online version in colour.)