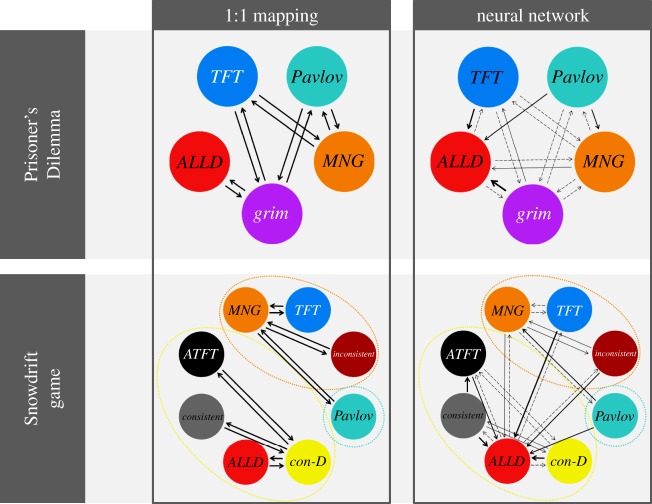
Figure 5.
Mutational distance between the most relevant strategies in the Prisoner's Dilemma (top) and the ISD (bottom), for both behavioural architectures and the case of per-locus mutation. An arrow pointing from one strategy to another indicates that a mutation of the former strategy has probability of larger than 0.001 to yield the latter strategy. A probability of more than 0.05 is indicated by a solid arrow (the thickness of the arrow is proportional to the probability). In the 1 : 1 model, each strategy can mutate to four other strategies with equal probability, so the arrows in the mutation maps for the 1 : 1 model all represent a probability of 0.25. To calculate these probabilities, we first generated a large number of random genotypes (in the same way as generating a genotype through ‘entire-genome mutation’), and determined their corresponding strategy. Then, for each strategy, we mutated all corresponding genotypes many times, and again determined the resulting strategies.

