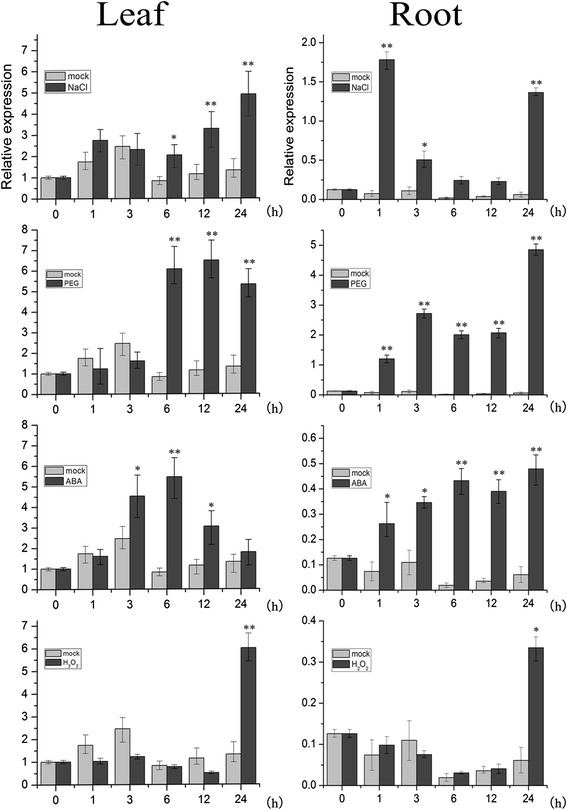
Fig. 1.

Expression patterns of TaNAC29 in wheat after stress treatments. Expression patterns of TaNAC29 in wheat leaves and roots after NaCl, PEG6000, ABA and H2O2 treatments by qRT-PCR analysis. Leaf and root were collected after different stress treatment. The 2−ΔΔCT method was used in qRT-PCR analysis. Transcript levels were normalized to TaActin. Values are means ± SE of three replicates. Asterisks indicate statistically significant differences from mock (*P < 0.05; **P < 0.01). Three independent experiments were performed
