
Fig. 3.
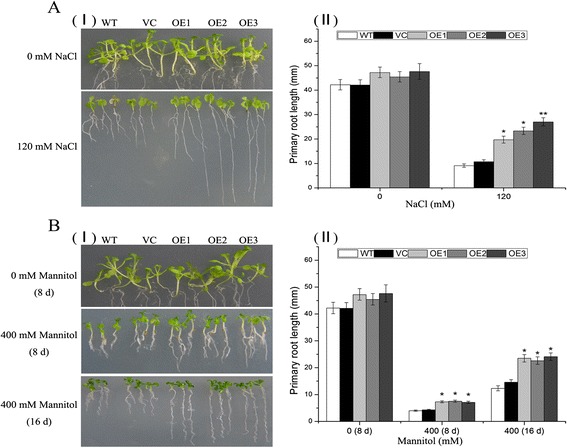
Root length assays of WT, VC (vector control) and overexpression (OE) lines. a Phenotypes of WT, VC and OE plants grown for 8 d on medium supplemented with 0 or 120 mM NaCl (I) and primary root length (II). b Phenotypes of WT, VC and OE plants grown for 8 and 16 d on medium supplemented with 0 or 400 mM Mannitol (I) and primary root length (II). Values are means ± SE (n = 20 to 25 plants) in root length assays. Asterisks indicate statistically significant differences from WT (*P < 0.05, **P < 0.01)