
Fig. 6.
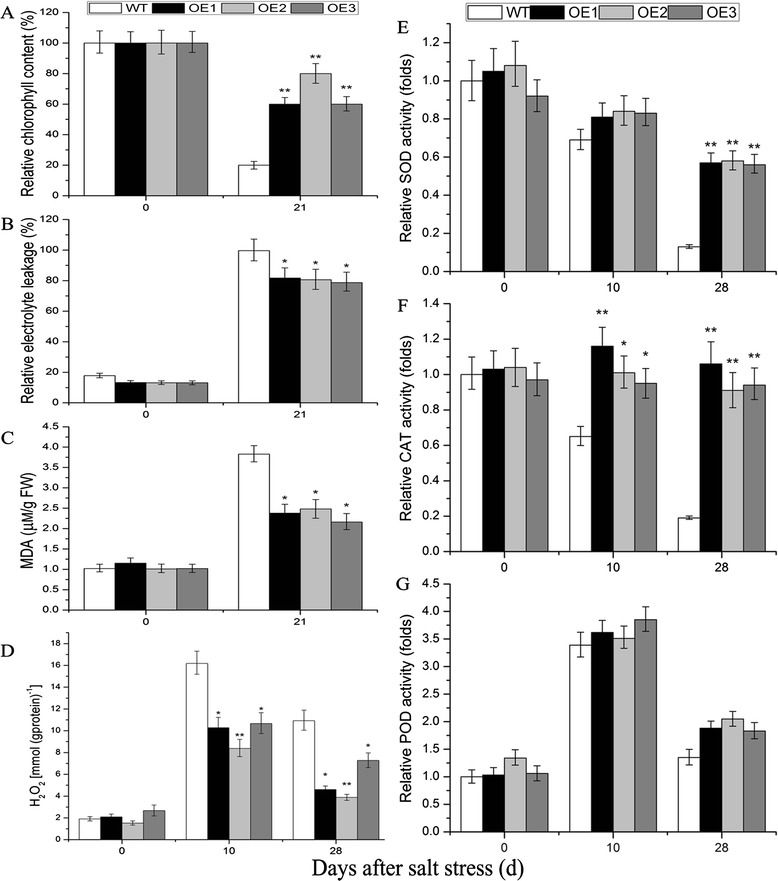
Analysis of physiological indices under salt stress conditions. Analysis of chlorophyll content (a), electrolyte leakage (b), MDA content (c), H2O2 content (d) and SOD (e), CAT (f), POD (g) activities in WT and TaNAC29-overexpression (OE) lines under normal and 250 mM salt stress conditions. Seedlings leaves were sampled from WT and TaNAC29-overexpression lines at 0 (as a negative control), 10, 21 or 28 DAT to detect physiological indices. Values are means ± SE of three replicates. Asterisks indicate statistically significant differences from WT (*P < 0.05; **P < 0.01)