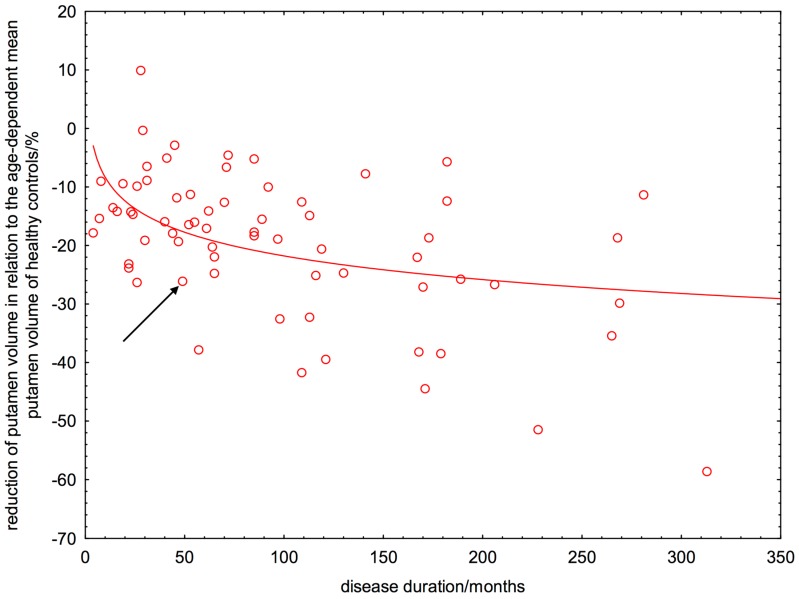
Figure 5.
Logarithmic estimation of age-corrected loss of putamen volume in relation to healthy controls versus the patients’ disease duration. The arrow indicates a patient with a disease duration of 50 months who had a 26% lower putamen volume than expected from a healthy control with the same age as the patient.

