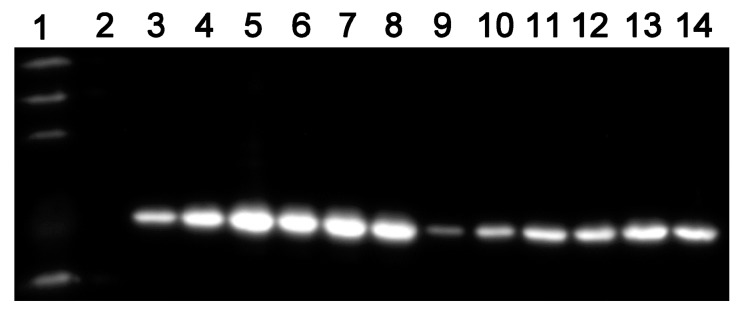
Figure 4.

Western blot analysis of the relationship between ASADH expression and the concentration of pristinamycin over time (20 μg of total protein were loaded for cataphoresis). Lane 1, EasySee Western Marker; Lane 2 starved mutant; Lanes 3–8, ASADH expression on days 1, 3, 5, 7, 9, and 11 at 10−1 µg/mL; Lanes 9–14, ASADH expression on days 1, 3, 5, 7, 9, and 11 at 10−5 µg/mL. The experiments were repeated three times, and typical images are shown.
