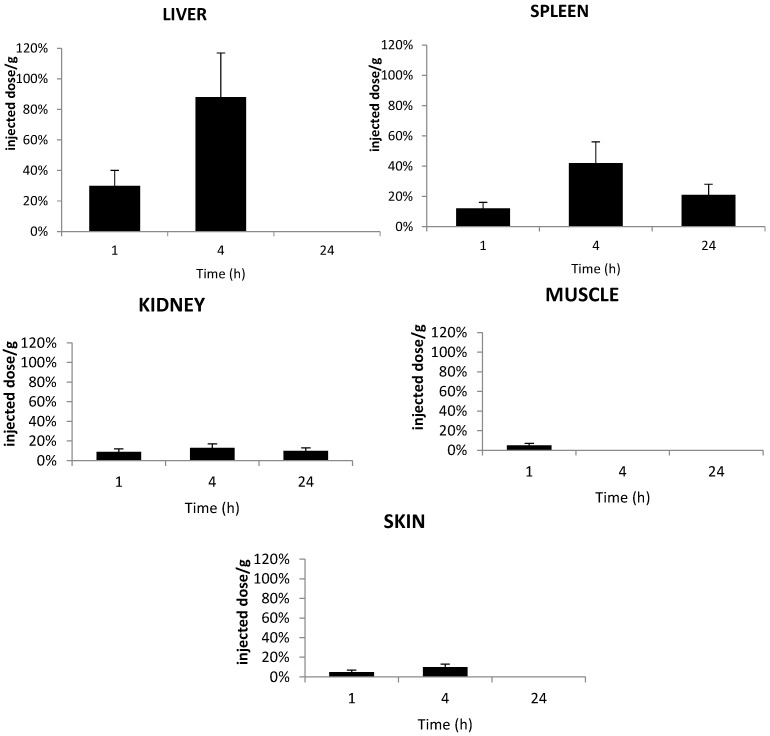
Figure 9.
In vivo concentrations of TPC–PEG18–TKPRR in the liver, kidneys, spleen, muscle and skin of healthy mice. Concentrations were determined by HPLC analysis of the tested tissues and expressed as the percentage of injected dose per gram plasma, expressed as a function of time at one, four and 24 h after the intravenous injection of 2.8 mg/kg (data points show the mean ± S.D., n ≥ 3).

