Figure 6.
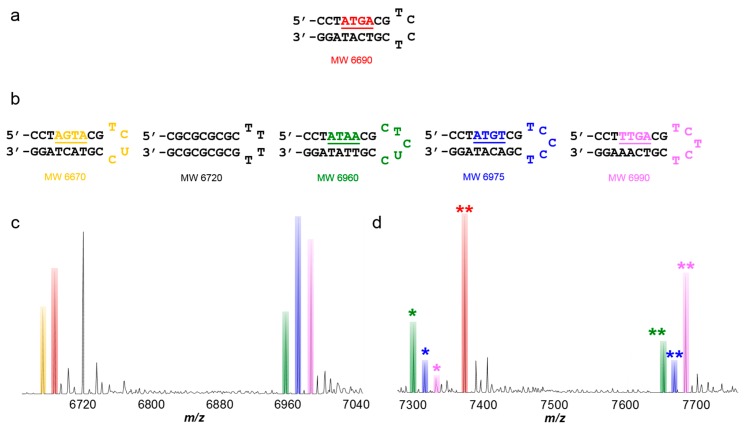
(a) The ATGA target base pair site for DB293; (b) ATGA-variant hairpin DNA sequences used for ESI-MS studies with preserved flanking base pair sequences, modified hairpin loops, and mutant target sites; (c) spectrum of unbound AGTA, ATGA, reference sequence, ATAA, ATGT and TTGA sequences; (d) spectrum of complexes formed between DB293 and ATAA, ATGT, TTGA and ATGA sequences. Unbound DNA is unlabeled with corresponding color bar. Respective monomer complexes labeled with (*) for each titration. Dimer complexes (i.e., 2 to 1 stoichiometry) labeled as (**). Molar concentration ratios for compound to DNA are [4 to 1]. T = thymidine; A = adenosine; G = guanidine; C = cytidine.

