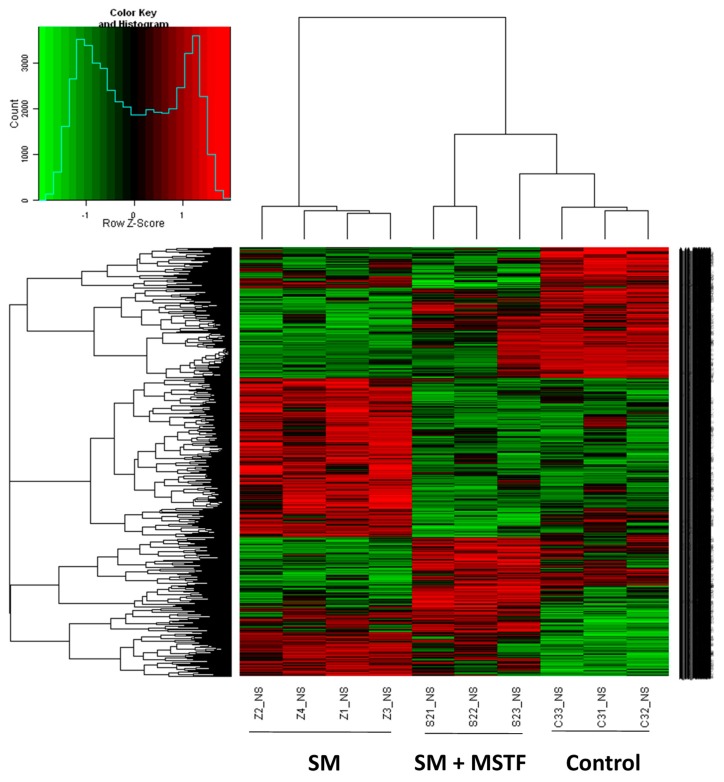
Figure 3.
Hierarchical cluster analysis of individual rats according to the profile of gene expression examined. The whole genome microarray was conducted on rat liver tissues 24 h after the application of SM. Then, 4869 transcripts (probe sets) were organized by hierarchical clustering based on overall similarity in expression patterns. Red represents relative expression greater than the median expression level across all samples, and green represents an expression level lower than the median. Black indicates intermediate expression. Rats from the same treatment group are the closest. The control group is close to the SM + MSTF group treated with MSTF (120 mg/kg) 1 h after SM treatment and clearly separate from the SM-only-treated group.

