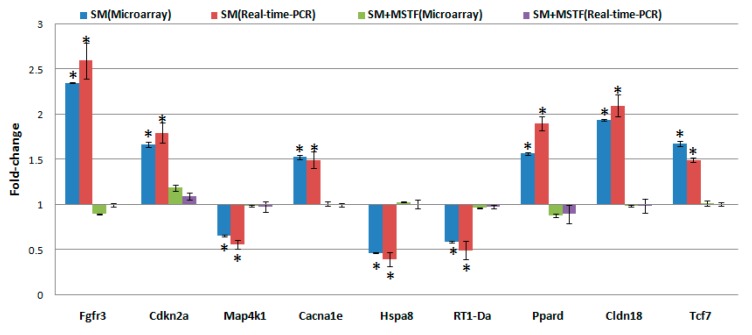
Figure 6.
Quantitative real-time PCR confirmation of the microarray data. qRT-PCR was performed on nine genes that showed differential expression in treatment groups (SM, SM + MSTF) versus untreated controls. Gene expression levels are shown as the mean normalized to the expression of the housekeeping gene β-actin. Each sample was measured in triplicate. Columns, mean of three or four rats in the microarray experiment or a mean of five rats in PCR; bars, SD. Asterisks indicates statistical significance compared to the control (non-SM exposed rats) by the t-test (p < 0.05). The comparison of the fold change produced by the microarray with the relative expression ratio obtained from real-time PCR, with good concordance.

