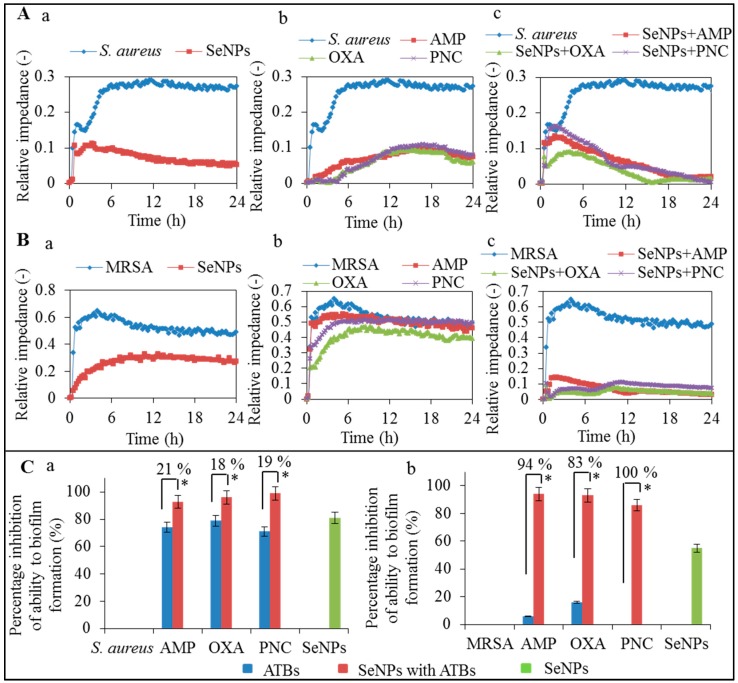
Figure 2.
(A) Monitoring of biofilm disruption after application of 100 μM SeNPs on S. aureus—blue line (a) and ATBs (100 μM): ampicillin—red line, oxacillin—green line, penicillin—purple line on S. aureus—blue line (b) and complexes of SeNPs (100 μM) with the same ATBs (100 μM) on S. aureus—blue line (c); (B) Monitoring of biofilm disruption after application of 100 μM SeNPs on MRSA—blue line (a) and ATBs (100 μM) ampicillin—red line, oxacillin—green line, penicillin—purple line on MRSA—blue line (b) and complexes of SeNPs (100 μM) with the same ATBs (100 μM) on MRSA—blue line (c); (C) Comparison of differences in relative impedance after application of 100 μM concentration of ATBs or complexes of ATBs with SeNPs (100 μM) and SeNPs alone (100 μM) on S. aureus (a) and MRSA (b) after 24 h of measurement. All data represent mean ± S.D. from three measurements, NS, not significant, * p < 0.05.

