Figure 2.
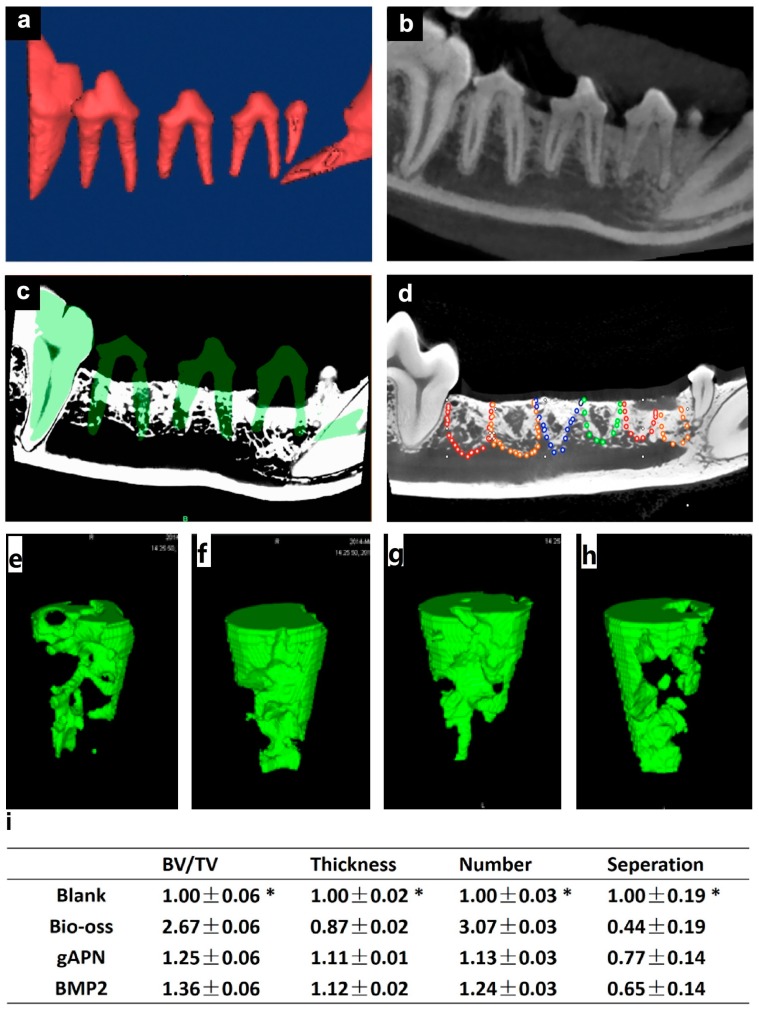
Extraction socket location and μCT analysis: (a) 3D CBCT (Cone Beam Computed Tomography) reconstructions and (b) the teeth used for reference; (c) Superimposition 3D CBCT and μCT models; (d) Highlighted borderline of the extraction socket in the μCT models (red: gAPN-treated group, orange: BMP2-treated group, blue: Bio-Oss group, green: blank group). Representative 3D reconstruction of the trabecular structure in the extraction socket: (e) Blank; (f) Bio-oss; (g) gAPN and (h) BMP2; and (i) Changes in trabecular bone parameters, including trabecular bone volume normalised by tissue volume (BV/TV), trabecular thickness (Tb.Th), trabecular number (Tb.N), and trabecular separation (Tb.Sp) are shown as means ± SD, with n = 4. * p < 0.05, as determined by one-way ANOVA.

