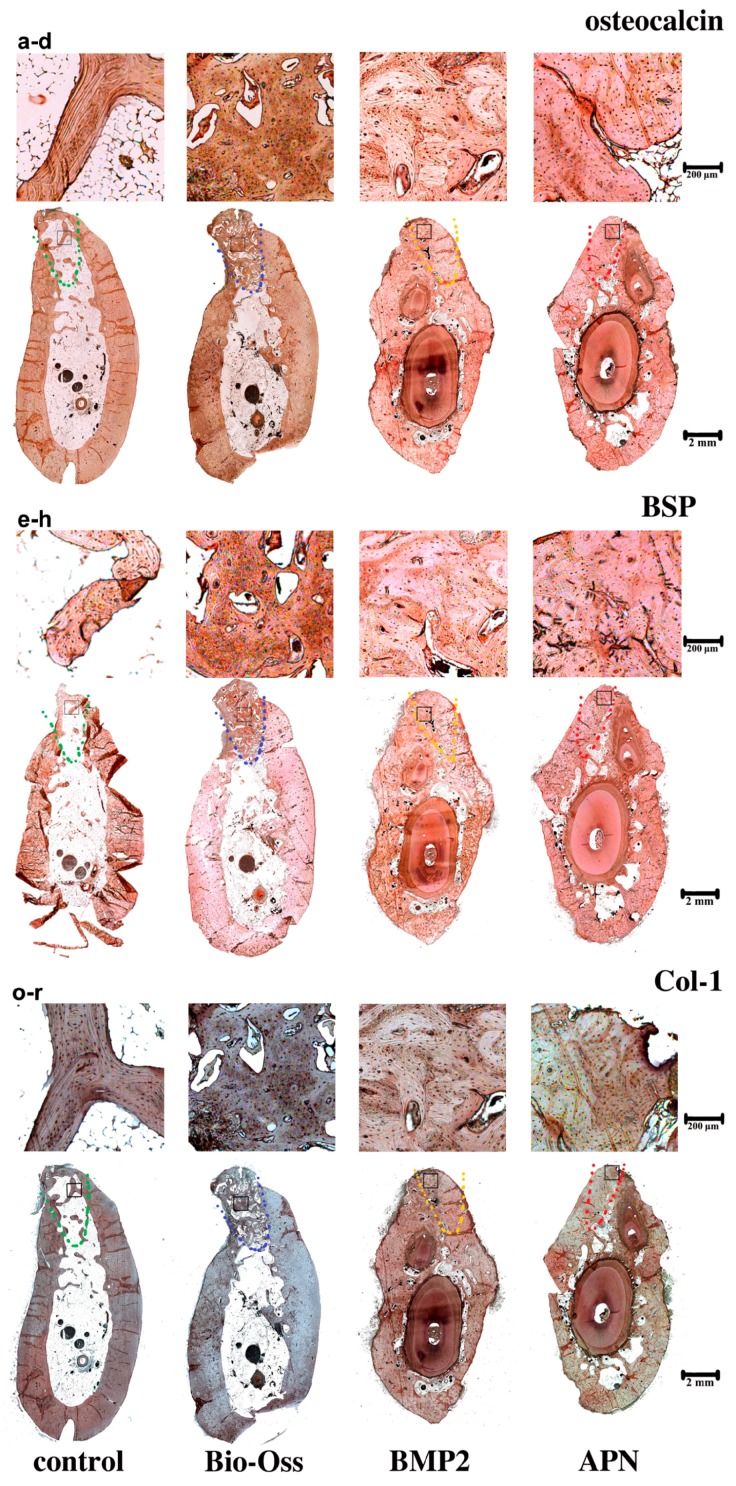
Figure 6.
Expression of osteogenic related protein following the different 12-week treatments in the extraction sockets. Imunohistochemical analysis of extraction socket trabecular bone sections for (a–d) OCN (Osteocalcin); (e–h) BSP (Bone sialoprotein) and (o–r) Col-1 (Collagen 1). (a,e,o) the control group; (b,f,p) Bio-Oss group; (c,g,q) BMP2 group; (d,h,r) APN group. The black square represents the magnifying area. The dashed line represents the extraction sockets. Magnification: upper panel 40×; lower panel 4×. n = 4 for each group.

