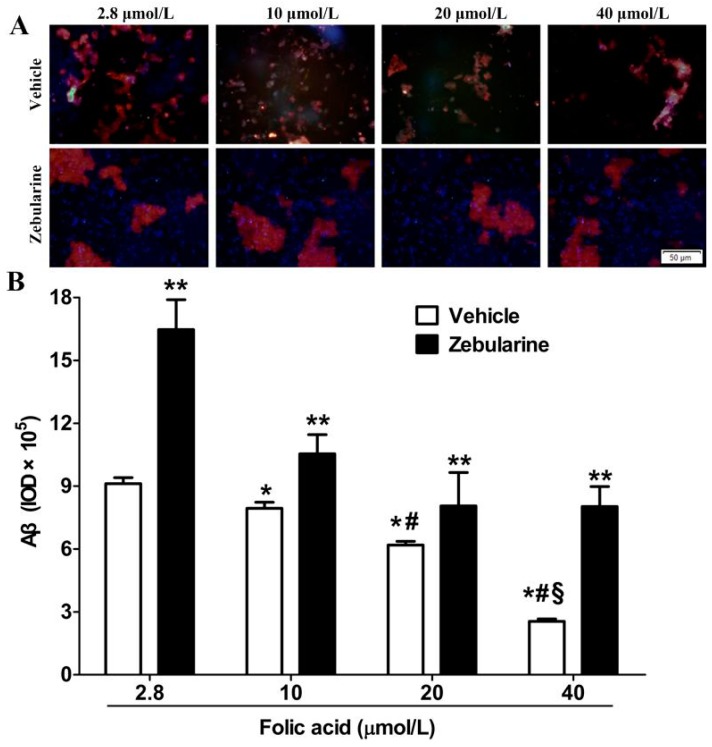
Figure 2.
Folic acid decreases, and zebularine increases, Aβ production in N2a-APP cells. The cells were incubated with 2.8, 10, 20 or 40 μmol/L folic acid for 96 h, and with either zebularine or its vehicle present during the first 12 h. Subsequently Aβ was detected by immunofluorescence staining (red), nucleus staining by DAPI (blue). (A) Representative images showing Aβ immunofluorescence; (B) Summary of Aβ production levels shows mean ± SEM for integrated optical density (IOD) of immunoreactive Aβ in 3 experiments. * p < 0.05 compared with 2.8 μmol/L. # p < 0.05 compared with 10 μmol/L. § p < 0.05 compared with 20 μmol/L. ** p < 0.05 compared with vehicle at the same folate concentration. Scale bar = 50 μm.

