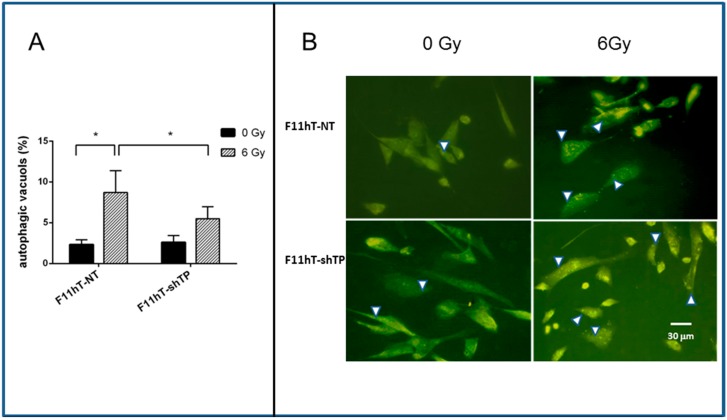
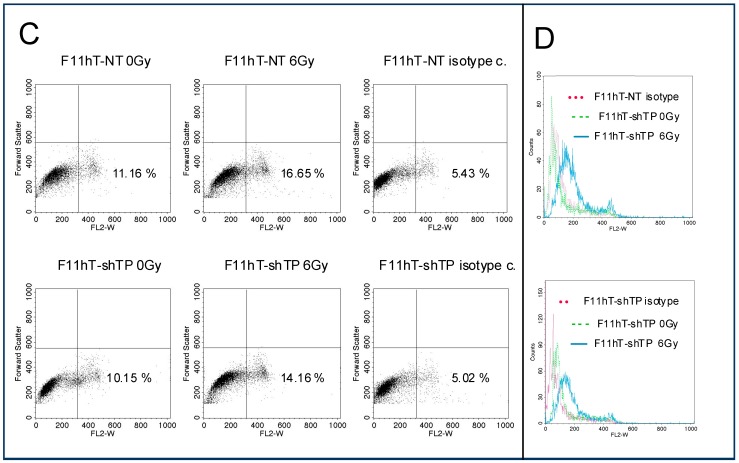
Figure 4.
The effect of TP53inp1 silencing on the formation of radiation-induced autophagic vacuoles. (A) Quantitation of autophagic vacuoles shows a significant increase in the 6 Gy treated groups as compared to the sham irradiated F11hT-NT cells (* p value < 0.5). Silencing of TP53inp1 is resulted significantly less autophagosome in 6 Gy-exposed F11hT-shTP cells (* p value < 0.5). Two days after irradiation, cells were treated with Acridine Orange dye and red (autophagosome) puncta were counted from minimum eight cover slips (n ≥ 8) under fluorescent microscope. White arrowheads denote the autophagic vacuoles. Results were analyzed with One-way ANOVA; (B) fluorescence photomicrograps obtained after Acridine Orange staining. Control cells (0 Gy) showing a few cytoplasmic AV formation, the number of AV increased in irradiated F11hT-NT cells and, to a lesser extent, in F11hT-shTP cells; (C) Representative flow cytometry plots are demonstrative of LC3B intracellular staining in response to 6 Gy exposures. Dot plot analysis is derived from the non-gated cell population. Flow cytometry analysis of F11hT-NT and F11hT-shTP cells using LC3B Antibody (Sigma, St. Louis, MI, USA) compared to a nonspecific isotype control antibody. Acquisition of 10,000 events was collected and for analysis the CellQuest software (BD Biosciences, San Jose, CA, USA) was used; (D) Representative flow cytometry histograms of percent LC3B-positive fibroblast are shown at right. Labeling of LC3B-positive cells at 48 h in F11hT-NT cells (right, top graph) and F11hT-shTP cells (right, bottom graph) after irradiation are graphed.


