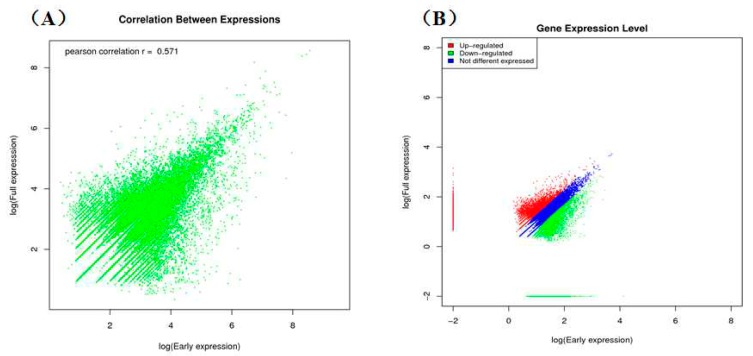
Figure 4.
The scatter of expressed genes in the early and full flowering stages of safflower. The blue dots represent genes that are not differentially expressed, and the red and green dots represent up-regulated and down-regulated genes, respectively. (A) Correlation between expression in the early and full flowering stages of safflower; (B) Gene expression level in the early and full flowering stages of safflower.

