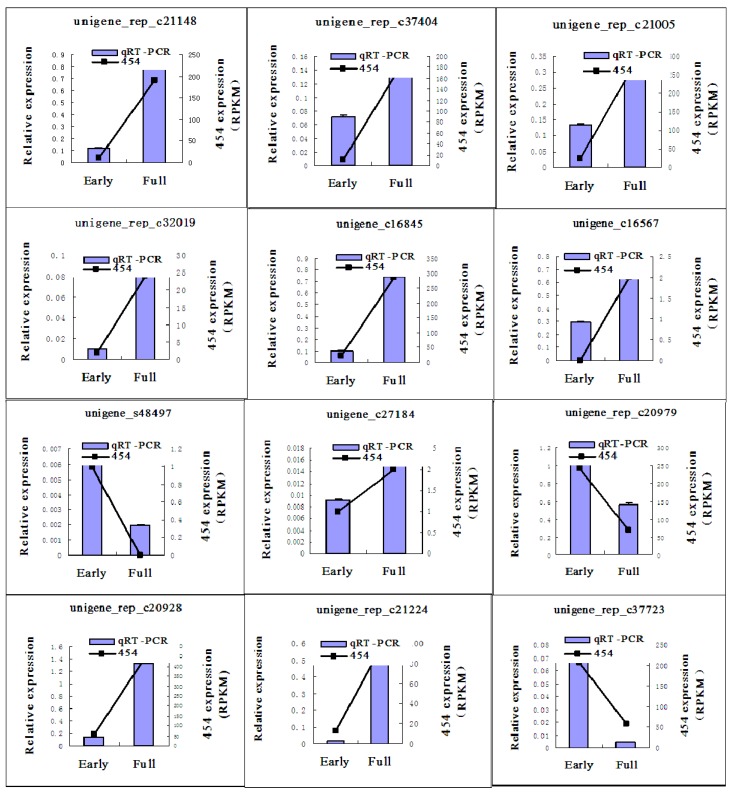
Figure 8.
qRT-PCR validation of selected safflower unigenes. The qRT-PCR data are presented as the mean value of three repeats. “454” indicates the value of the unigene in 454 pyrosequencing. “Early” indicates the early flowering stage and “full” indicates the full flowering stage. Error bars indicate the standard deviation of the mean value of each stage.

