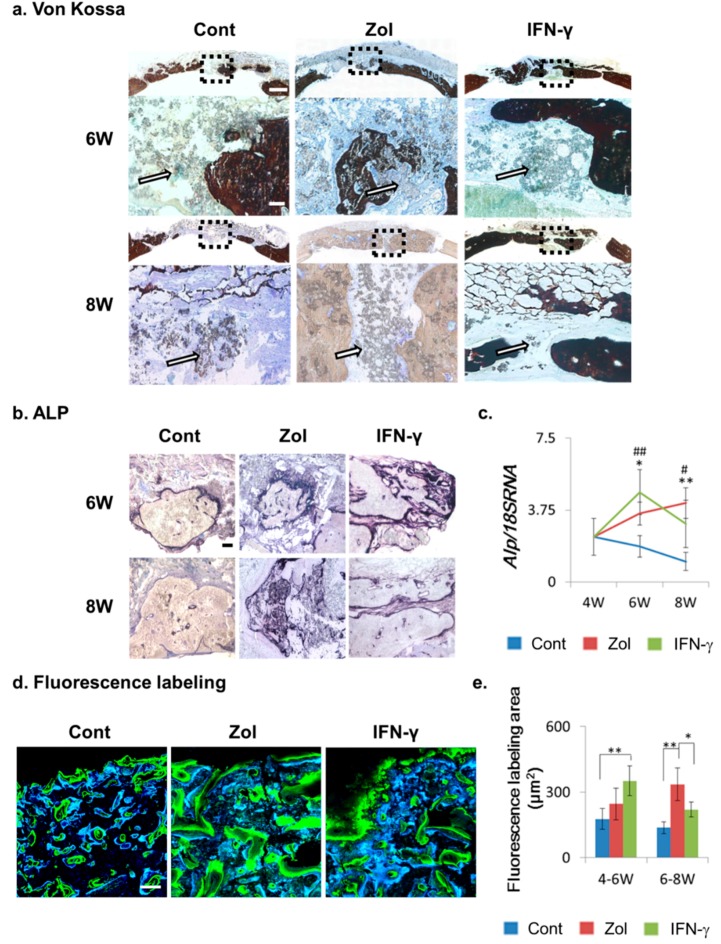
Figure 3.
Bone-turnover capacities of material implants following drug treatment. (a) Von Kossa staining. Brown staining represents bone tissue, and white arrows show the α-TCP/CS particles in the bone defect. Broken squares represent the magnified areas; (b) Alkaline phosphatase (ALP) staining. Black staining represents ALP-positive tissue; (c) Alp mRNA expression in bone defects. Data show the mean ± SD (n = 4). # Control vs. IFN-γ; * Control vs. Zol; *,# p < 0.05; **,## p < 0.01 (Tukey–Kramer method); (d) Fluorescence labeling analysis. Calcein (blue staining: new bone growth at 4–6 weeks post-implantation) and tetracycline (green: new bone growth at 6–8 weeks) labeling of regenerative bone tissue in calvarial defects. Scale bars: von Kossa = 1.8 mm and 120 μm (magnified areas), ALP staining = 120 μm, fluorescence labeling = 100 μm; (e) Quantification of labeling fluorescence. The data show the mean ± SD (n = 4). * p < 0.05, ** p < 0.01 (Tukey–Kramer method).

