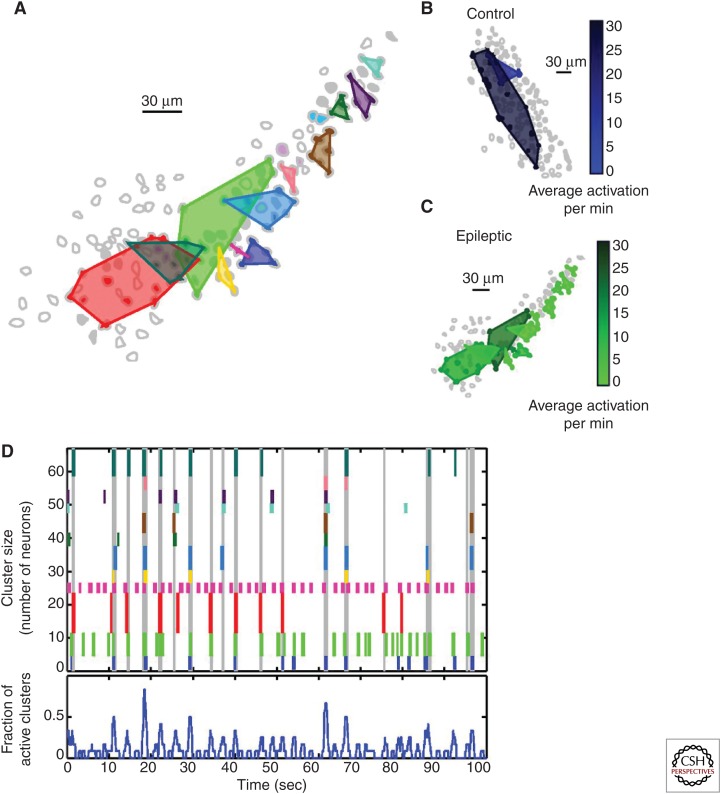
Figure 1.
Neuronal cluster recruitment during epileptiform events. (A) Spatially localized clusters of neurons in the granule cell layer from tissue from an epileptic animal showing synchronous firing patterns are demarcated by polygons. (B,C) Spatial mapping and activation frequency of neuronal clusters from tissue from a control (B) and an epileptic animal (C). Lighter cluster shades indicate lower frequency of activation. (D, top) Raster plot of the activity of clusters diagrammed in A, represented by short vertical lines in corresponding colors; the height of the individual colored lines indicates the number of cells composing the cluster. Vertical gray lines extending the entire raster plot designate detected large-scale network events. (D, bottom) Fraction of active clusters over time. (From Feldt Muldoon et al. 2013; adapted, with permission, provided by the PNAS open access option.)

