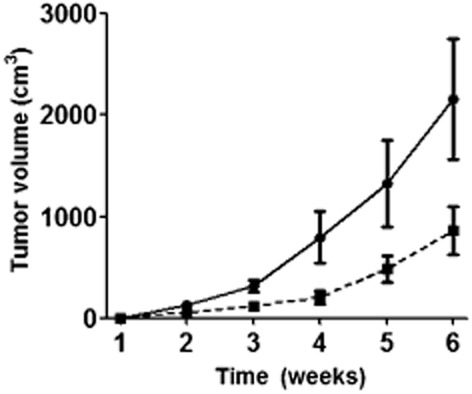
Figure 6.

Effect of enforced expression of micro ribonucleic acid (miR)-101 on the growth of A549 cells in vivo. Solid line: the growth curve of tumor xenografts of A549- negative control (NC) cell. Dotted line: the growth curve of tumor xenografts of A549-miR-101 cell. The tumor volume of A549-miR-101 was lower than that of A549-miR-NC cells since week 4.  , A549-miR-NC;
  , A549-miR-101.
