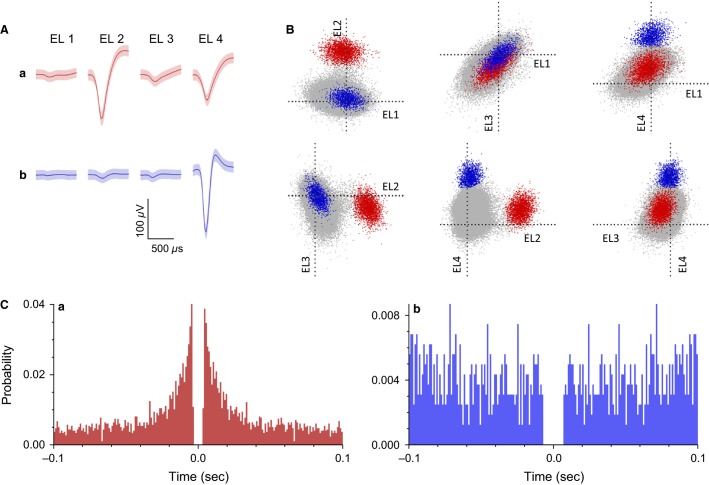
Figure 2.
Example waveforms of two amygdalar neurons isolated by an offline cluster analysis. (A) Waveforms (mean ± SD, shaded) recorded from four electrodes (tetrode) (EL 1–4). The waveforms indicated by a and b correspond to the two neurons (a and b), respectively, identified by the offline cluster analysis in B. (B) The results of an offline cluster analysis. Each dot represents one neuronal spike. The axes represent the first principle component of each of the four electrodes. Two colored clusters (red and blue, corresponding units a and b in A, respectively) are recognized. (C) Autocorrelograms of the neurons. Bin width = 1 msec. Ordinates indicate probability, where bin counts were divided by the number of spikes in the spike train.

